Comparative Study
. 2008 Feb;5(2):e35.
doi: 10.1371/journal.pmed.0050035.

An erythroid differentiation signature predicts response to lenalidomide in myelodysplastic syndrome

Affiliations
Comparative Study

An erythroid differentiation signature predicts response to lenalidomide in myelodysplastic syndrome

Benjamin L Ebert et al. PLoS Med. 2008 Feb.

Abstract

Background: Lenalidomide is an effective new agent for the treatment of patients with myelodysplastic syndrome (MDS), an acquired hematopoietic disorder characterized by ineffective blood cell production and a predisposition to the development of leukemia. Patients with an interstitial deletion of Chromosome 5q have a high rate of response to lenalidomide, but most MDS patients lack this deletion. Approximately 25% of patients without 5q deletions also benefit from lenalidomide therapy, but response in these patients cannot be predicted by any currently available diagnostic assays. The aim of this study was to develop a method to predict lenalidomide response in order to avoid unnecessary toxicity in patients unlikely to benefit from treatment.

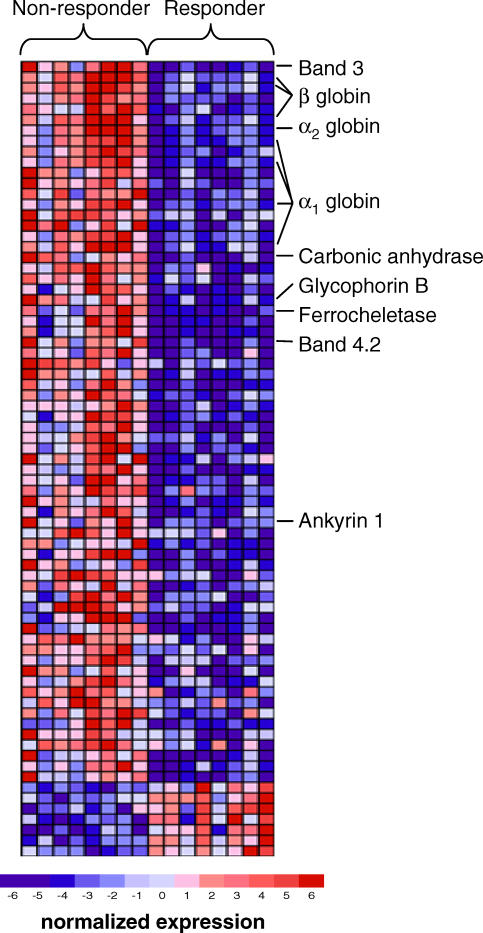
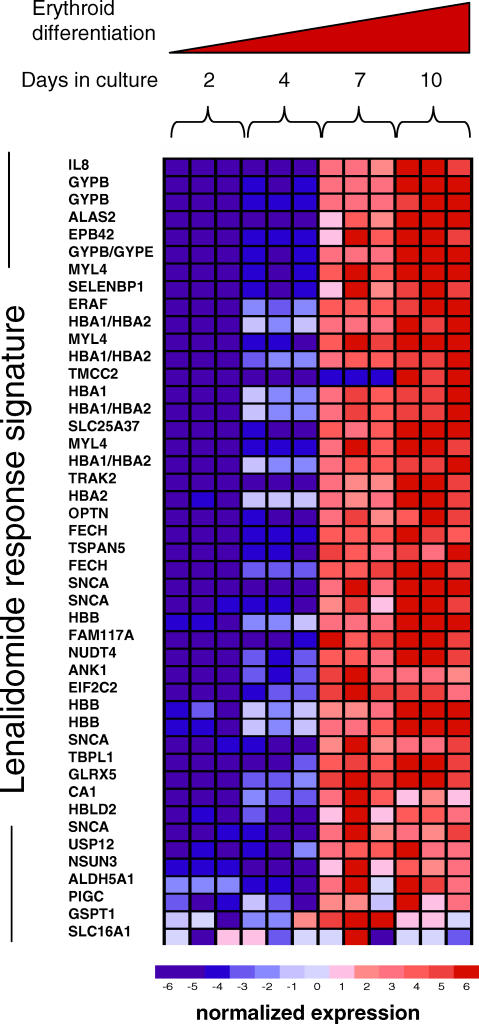
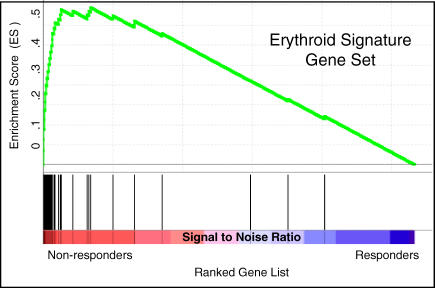
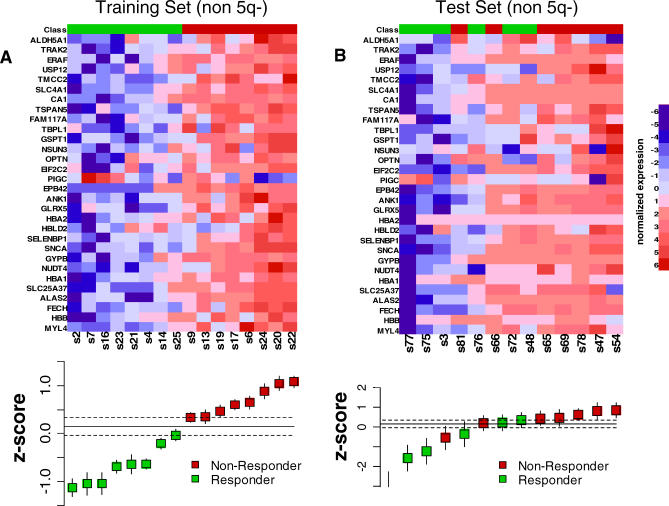
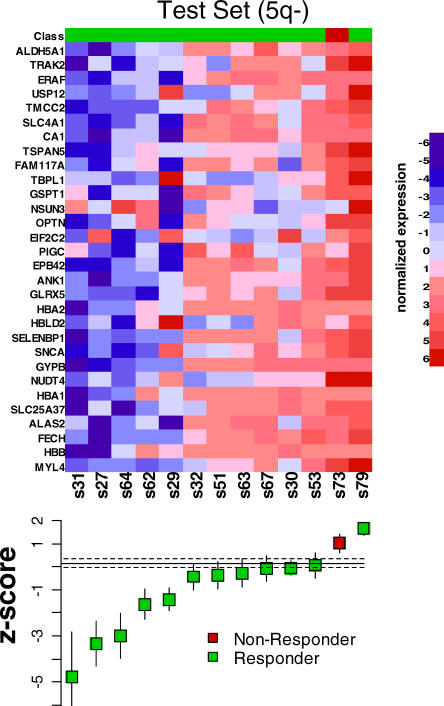
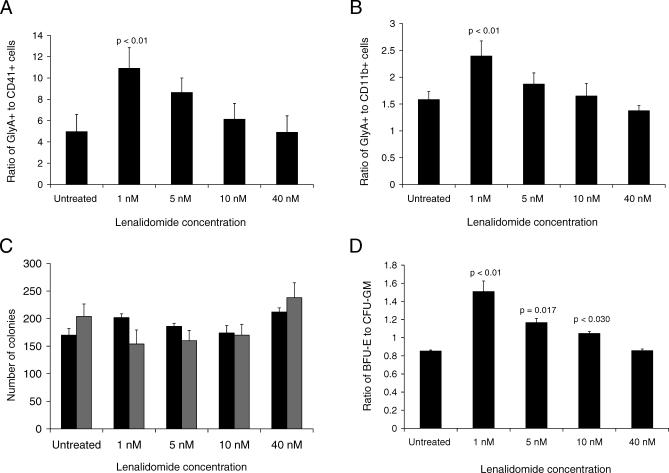
Methods and findings: Using gene expression profiling, we identified a molecular signature that predicts lenalidomide response. The signature was defined in a set of 16 pretreatment bone marrow aspirates from MDS patients without 5q deletions, and validated in an independent set of 26 samples. The response signature consisted of a cohesive set of erythroid-specific genes with decreased expression in responders, suggesting that a defect in erythroid differentiation underlies lenalidomide response. Consistent with this observation, treatment with lenalidomide promoted erythroid differentiation of primary hematopoietic progenitor cells grown in vitro.

Conclusions: These studies indicate that lenalidomide-responsive patients have a defect in erythroid differentiation, and suggest a strategy for a clinical test to predict patients most likely to respond to the drug. The experiments further suggest that the efficacy of lenalidomide, whose mechanism of action in MDS is unknown, may be due to its ability to induce erythroid differentiation.


Conflict of interest statement

Competing Interests: Azra Raza and Richard Stone are involved with a speaker's bureau for Celgene.

Figures

Figure 1
Figure 1. Gene Expression Signature of Lenalidomide Responsiveness
Rows correspond to the expression of different genes, and columns correspond to different patient samples. The highest expression of each gene across the samples is portrayed in dark red while the lowest expression is shown in deep blue. Genes with well-documented roles in erythroid differentiation are noted. All genes are listed in Table S2 along with their associated signal-to-noise values, FDR, and fold change between responders and nonresponders.
Figure 2
Figure 2. Expression of the Lenalidomide Response Signature during Erythroid Differentiation
Gene expression profiles were obtained from human adult bone marrow CD34+ cells undergoing erythroid differentiation in vitro at days 2, 4, 7, and 10. Genes are ranked in order of differential expression between day 2 versus day 10. The genes in this signature are coordinately expressed during erythroid differentiation, from lower expression (blue) in immature progenitor cells to higher expression (red) in terminal erythroid differentiation. Some of the genes from Figure 2 are not present in Figure 3 due to the greater number of probe sets on HG_U133 Plus 2.0 microarrays than HG_U133AAofAv2 microarrays. All genes are listed in Table S3.
Figure 3
Figure 3. Gene Set Enrichment Analysis Using the Response Signature
Expression of the response signature, defined in the training set of samples, was analyzed in an independent test set of samples from MDS patients without 5q deletions. GSEA is a nonparametric statistical methodology that examines whether a set of genes, e.g., the response signature, occur towards the top of a list of genes that is ranked according to a class distinction. In this case, all genes on the microarray were ranked by signal-to-noise ratio in order of their differential expression between nonresponders and responders. Black bars at the bottom of the figure indicate the location of genes in the response signature within the ranked list. The running enrichment score is shown in green. Nearly all of the genes in the erythroid response are expressed more highly in the non-responder class and are at the top of the ranked list of genes, resulting in a strong and statistically significant enrichment score (p < 0.001).
Figure 4
Figure 4. Prediction of Lenalidomide Response Using the Response Signature
Each gene in the response signature was normalized to a reference signature and converted to a z-score. The heat maps depict the normalized expression of each gene in the response signature. High expression is shown in red, and low expression is shown in blue. The box-and-whisker plots below the heat maps depict the average z-scores for the response signature for each sample. The dotted lines indicate the zone in which no call can be made between responder and nonresponder. In the training set (A), all samples are correctly separated by the predictor. In the test set (B), lenalidomide response is correctly predicted nine out of 11 samples (82%), and no call could be made in two samples.
Figure 5
Figure 5. Prediction of Lenalidomide Response in a Cohort of MDS with 5q Deletions
Normalized expression of each gene in the response signature is shown in the heat map. The box-and-whisker plots depict the average z-score for each sample. Response to lenalidomide was correctly predicted in ten out of 11 samples (91%).
Figure 6
Figure 6. Effects of Lenalidomide on Hematopoietic Differentiation In Vitro
Primary human bone marrow CD34+ cells were treated with lenalidomide. (A) In cells cultured with cytokines that support erythroid and megakaryocytic differentiation, low doses of lenalidomide increased the number of erythroid (GlyA+) cells relative to megakaryocytic (CD41+) cells as assessed by flow cytometry. (B) In cells cultured with cytokines that support erythroid and myeloid differentiation, low doses of lenalidomide increased the number of erythroid (GlyA+) cells relative to megakaryocytic (CD11b+) cells as assessed by flow cytometry. (C) Cells treated with lenalidomide were cultured for 3 d in liquid culture and then plated on methylcellulose. The total number of colony-forming units did not change significantly. As shown in (D), the ratio of erythroid (BFU-E) to myeloid (CFU-GM) colonies increased with low doses of lenalidomide. All p-values were calculated by two-tailed Student t-test. Confidence intervals for all measurements are portrayed in Figure S4.

Comment in

References

    1. Deangelo D, Stone R, editors. Myelodysplastic syndromes: biology and treatment. Philadelphia: Elsevier; 2005. pp. 1195–1208.
    1. Heaney ML, Golde DW. Myelodysplasia. N Engl J Med. 1999;340:1649–1660. - PubMed
    1. List A, Dewald G, Bennett J, Giagounidis A, Raza A, et al. Lenalidomide in the myelodysplastic syndrome with chromosome 5q deletion. N Engl J Med. 2006;355:1456–1465. - PubMed
    1. List AF, Kurtin S, Roe D, Buresh A, Mahadevan D, et al. Efficacy of lenalidomide in myelodysplastic syndromes. N Engl J Med. 2005;352:549–557. - PubMed
    1. Raza A, Reeves JA, Feldman EJ, Dewald GW, Bennett JM, et al. Phase II study of lenalidomide in transfusion-dependent, low- and intermediate-1-risk myelodysplastic syndromes with karyotypes other than deletion 5q. Blood. 2008;11:86–93. - PubMed

Publication types

MeSH terms