. 2008 Feb 19;105(7):2280-5.
doi: 10.1073/pnas.0706994105. Epub 2008 Feb 12.

Electroactive controlled release thin films

Affiliations

Electroactive controlled release thin films

Kris C Wood et al. Proc Natl Acad Sci U S A. .

Abstract

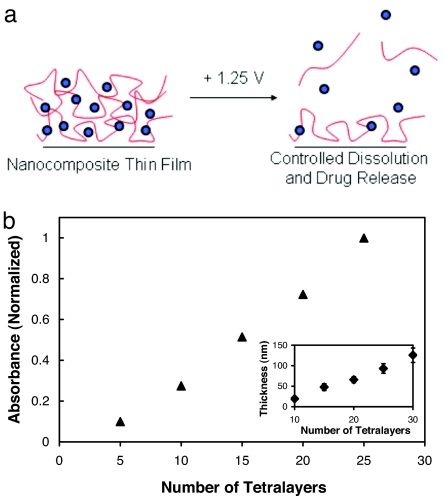
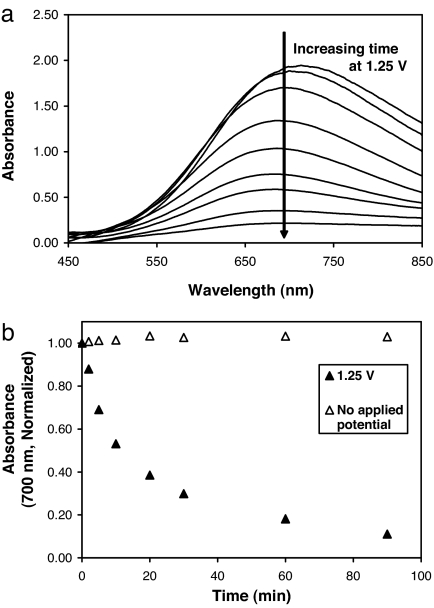
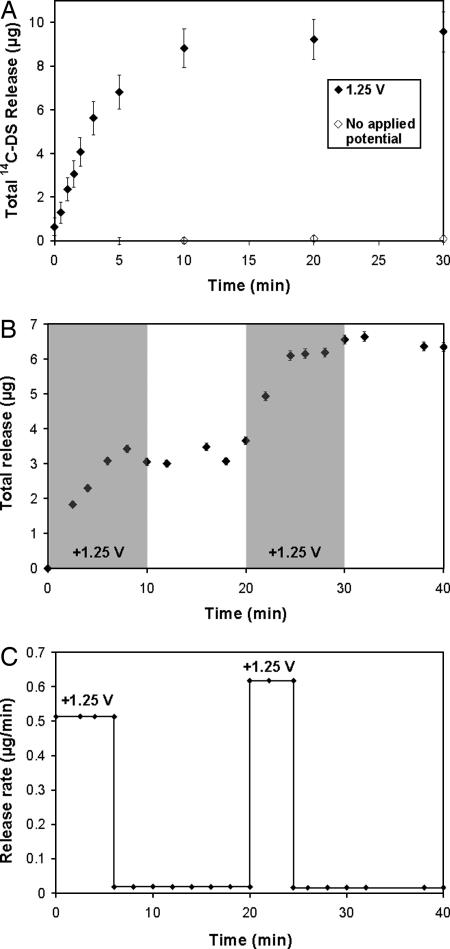
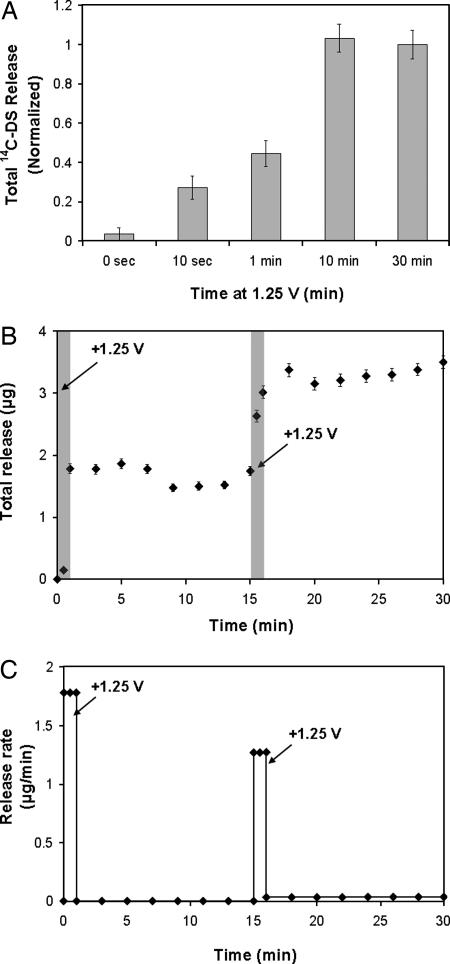
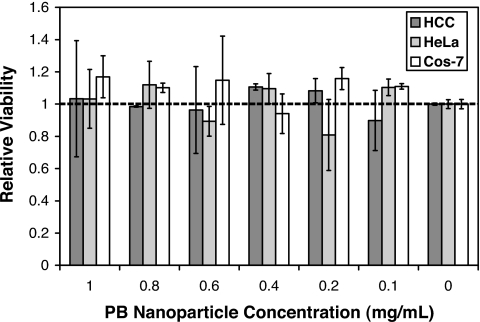
We present the fabrication of nanoscale electroactive thin films that can be engineered to undergo remotely controlled dissolution in the presence of a small applied voltage (+1.25 V) to release precise quantities of chemical agents. These films, which are assembled by using a nontoxic, FDA-approved, electroactive material known as Prussian Blue, are stable enough to release a fraction of their contents after the application of a voltage and then to restabilize upon its removal. As a result, it is possible to externally trigger agent release, exert control over the relative quantity of agents released from a film, and release multiple doses from one or more films in a single solution. These electroactive systems may be rapidly and conformally coated onto a wide range of substrates without regard to size, shape, or chemical composition, and as such they may find use in a host of new applications in drug delivery as well as the related fields of tissue engineering, medical diagnostics, and chemical detection.


Conflict of interest statement

The authors declare no conflict of interest.

Figures

Fig. 1.
Fig. 1.
Fabrication of LbL nanocomposite thin films based on PB. (a) Generalized schematic detailing the deconstruction of PB-based films containing drugs or other chemical species [blue circles represent PB nanoparticles and red lines represent drugs or chemical species (with or without a second encapsulating species)]. (b) Absorbance (700 nm) versus number of deposited tetralayers for the (LPEI/PB/LPEI/14C-DS)30 system as determined by UV-vis spectroscopy. Absorbance values are normalized to the absorbance of a 25-tetralayer film. (Inset) Thickness (nm) versus number of deposited tetralayers in the same system as determined by profilometry. Measurements were performed at six predetermined spots on the surface of the films, and error bars represent one standard deviation in measured values.
Fig. 2.
Fig. 2.
Electrochemically induced deconstruction of (LPEI/PB/LPEI/14C-DS)30 films. (a) Absorbance spectrum showing decreasing PB absorbance with increasing time at 1.25 V. (b) Normalized absorbance (700 nm) versus time for films with (filled triangles) and without (open triangles) an applied potential.
Fig. 3.
Fig. 3.
Release of a model compound, 14C-DS, from PB-containing films held at a constant potential of 1.25 V. All films are (LPEI/PB/LPEI/14C-DS)30. (a) Films held constant at 1.25 V (filled diamonds) or no applied potential (open diamonds) are shown. (b) Serial 14C-DS release from two (LPEI/PB/LPEI/14C-DS)30 films in a single solution. One film was held at the oxidizing potential for 10 min, followed by 10 min below the oxidizing potential. Next, the process was repeated with a second film in the same degradation bath. Periods during which an oxidizing potential was applied are shaded. (c) Release rate versus time for the films in b. In all cases, error bars represent one standard deviation in measured values.
Fig. 4.
Fig. 4.
On–off switchable destabilization of PB-containing (LPEI/PB/LPEI/14C-DS)30 films. (a) Total 14C-DS release from equivalent samples held at the oxidizing potential of 1.25 V for varying times (normalized to total release at 30 min). (b) 14C-DS release from a single film held at 1.25 V for 1-min intervals at t = 0 and 15 min. (c) Release rate from film shown in b. In all cases, error bars indicate one standard deviation in measured values.
Fig. 5.
Fig. 5.
MTT assay for cellular toxicity indicates that PB nanoparticles exhibit no toxicity on three different cell lines at concentrations up to 1.0 mg/ml. Error bars represent one standard deviation in measured values.

References

    1. LaVan DA, McGuire T, Langer R. Nat Biotechnol. 2003;21:1184–1191. - PubMed
    1. Santini JT, Richards AC, Scheidt R, Cima MJ, Langer R. Angew Chem Int Ed. 2000;39:2396–2407. - PubMed
    1. Santini JT, Cima MJ, Langer R. Nature. 1999;397:335–338. - PubMed
    1. Razzacki SZ, Thwar PK, Yang M, Ugaz VM, Burns MA. Adv Drug Deliv Rev. 2004;56:185–198. - PubMed
    1. Staples M, Daniel K, Cima MJ, Langer R. Pharm Res. 2006;23:847–863. - PubMed

Publication types

LinkOut - more resources