. 2008 Apr 18;283(16):10357-65.
doi: 10.1074/jbc.M800269200. Epub 2008 Feb 13.

Dexamethasone-induced inositol 1,4,5-trisphosphate receptor elevation in murine lymphoma cells is not required for dexamethasone-mediated calcium elevation and apoptosis

Affiliations

Dexamethasone-induced inositol 1,4,5-trisphosphate receptor elevation in murine lymphoma cells is not required for dexamethasone-mediated calcium elevation and apoptosis

Michael C Davis et al. J Biol Chem. .

Abstract

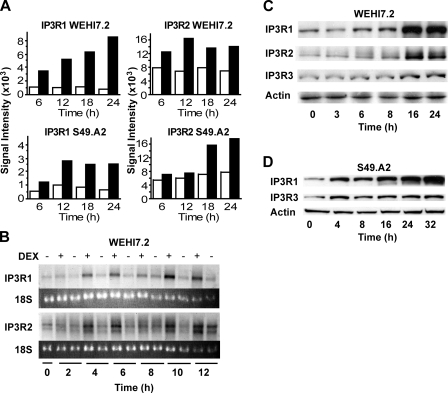
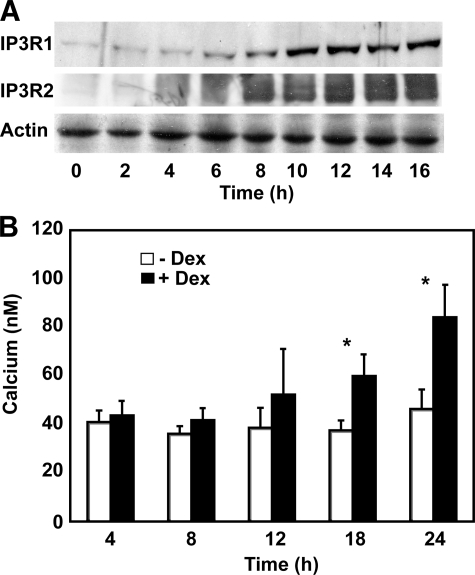
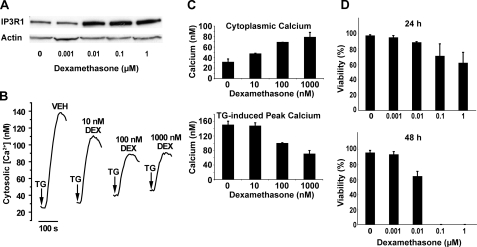
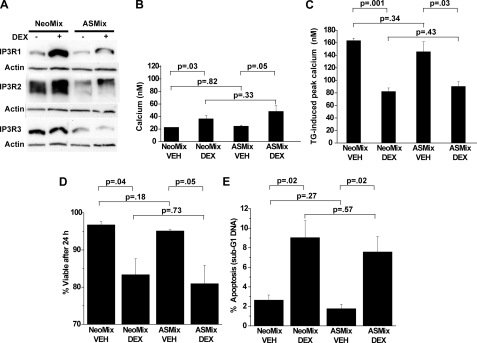
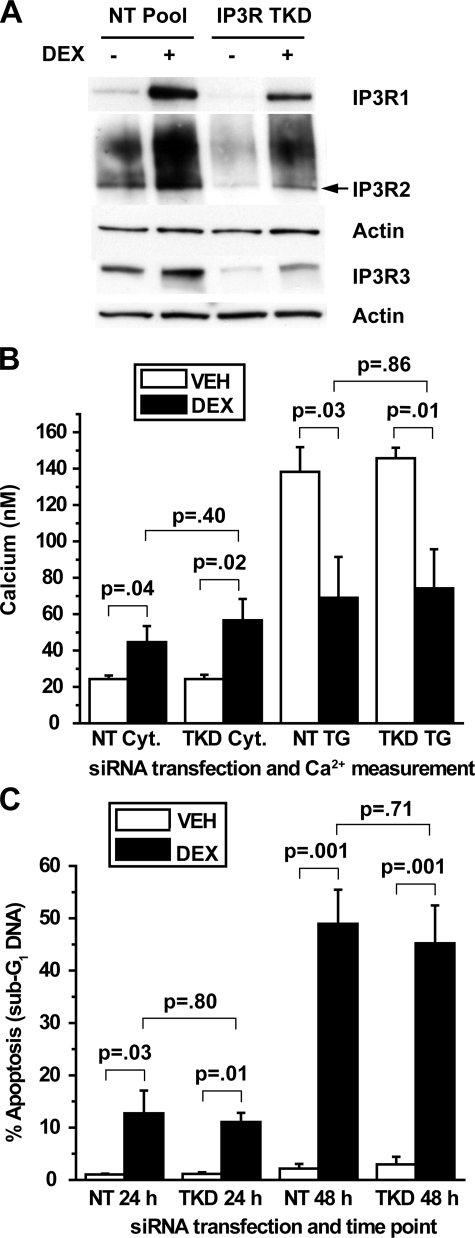
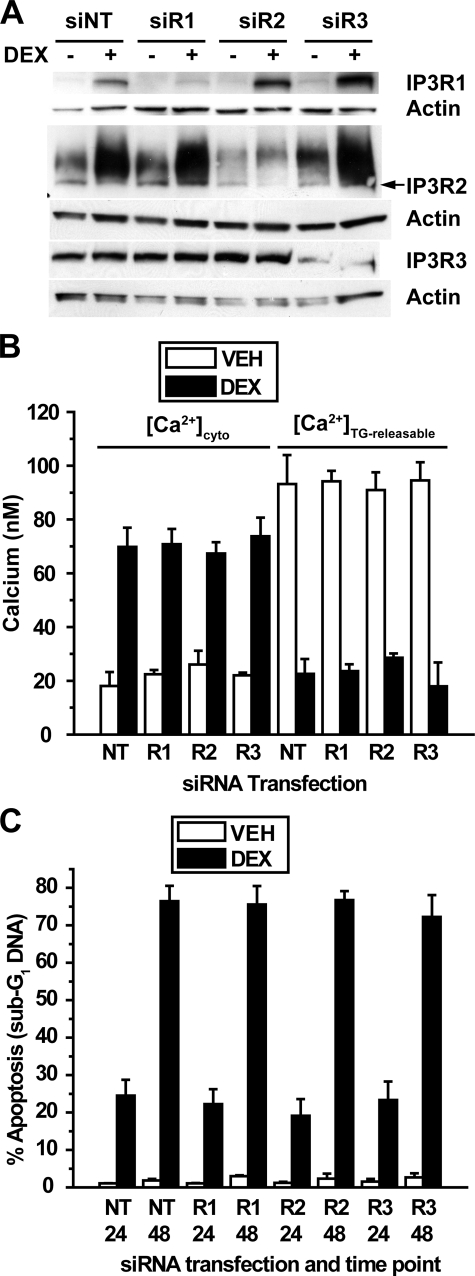
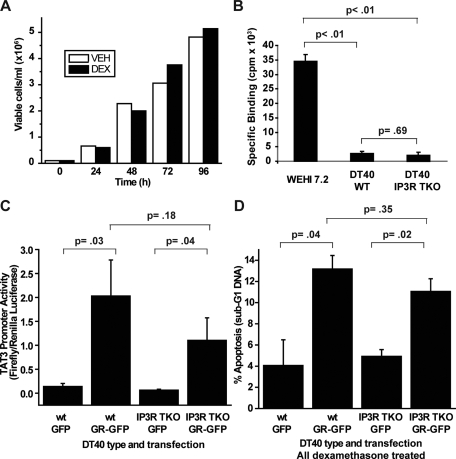
Glucocorticosteroid hormones, including dexamethasone, have diverse effects on immature lymphocyte function that ultimately lead to cell death. Previous studies established that glucocorticoid-induced alterations in intracellular calcium homeostasis promote apoptosis, but the mechanism by which glucocorticoids disrupt calcium homeostasis is unknown. Through gene expression array analysis, we found that dexamethasone induces a striking elevation of inositol 1,4,5-trisphosphate receptor (IP(3)R) levels in two murine lymphoma cell lines, WEHI7.2 and S49.A2. IP(3)R elevation was confirmed at both mRNA and protein levels. However, there was not a strong correlation between IP(3)R elevation and altered calcium homeostasis in terms of either kinetics or dose response. Moreover, IP(3)R knockdown, by either antisense or small interfering RNA, did not prevent either calcium disruption or apoptosis. Finally, DT40 lymphoma cells lacking all three IP(3)R isoforms were just as sensitive to dexamethasone-induced apoptosis as wild-type DT40 cells expressing all three IP(3)R isoforms. Thus, although alterations in intracellular calcium homeostasis contribute to glucocorticoid-induced apoptosis, these calcium alterations are not directly attributable to IP(3)R elevation.


Figures

FIGURE 1.
FIGURE 1.
IP3R induction by dexamethasone. A, signal intensities of labeled complementary RNA hybridized to oligonucleotide probes on Affymetrix arrays for IP3R1 and IP3R2 in WEHI7.2 and S49.A2 lymphoma cells. Cells were treated for the indicated times with ethanol vehicle (white bars) or 1 μm dexamethasone (black bars). Data represent the mean of duplicate samples. B, Northern blot analysis confirming elevation of IP3R1 and IP3R2 mRNA levels in WEHI7.2 cells following treatment with 1 μm dexamethasone (DEX). Results are representative of five experiments. C and D, immunoblots confirming elevation of IP3Rs in WEHI7.2 and S49.A2 cells treated with 1 μm dexamethasone. Results are representative of multiple independent experiments: five for WEHI7.2 and three for S49.A2.
FIGURE 2.
FIGURE 2.
Kinetics of IP3R and calcium elevations. A, an immunoblot, representative of multiple experiments, documenting the time course of IP3R1 and IP3R2 elevation in WEHI7.2 cells treated with 1 μm dexamethasone. IP3R elevation is detected as early as 6 h following dexamethasone addition and appears nearly maximal by 10 h. B, time course of cytoplasmic calcium elevation following treatment of WEHI7.2 cells with 1 μm dexamethasone (Dex). Error bars represent the mean ± S.E. of five separate experiments. *, p ≤ 0.01.
FIGURE 3.
FIGURE 3.
Dose-response relationships between IP3R elevation and calcium alterations and cell death. A, an immunoblot, representative of five separate experiments, demonstrating the elevation of IP3R1 following treatment of WEHI7.2 cells with the indicated concentrations of dexamethasone for 24 h. B, calcium traces demonstrating the dexamethasone (DEX) dose dependence of cytoplasmic calcium elevation and decreased TG-releasable calcium in WEHI7.2 cells treated with the indicated concentrations of dexamethasone for 24 h. Arrows indicate the point of TG addition. Traces are representative of three separate experiments, each performed with duplicate samples. C, cytoplasmic calcium concentration and TG-induced peak calcium elevation in WEHI7.2 cells treated with the indicated concentrations of dexamethasone for 24 h. Error bars represent the mean ± S.E. (n = 3). D, WEHI7.2 cell viability at 24 and 48 h following treatment with the indicated concentrations of dexamethasone. Error bars represent the mean ± S.E. (n = 3). Note that viable cells were not detected at the 48-h time point following treatment with 0.1 and 1 μm dexamethasone.
FIGURE 4.
FIGURE 4.
Antisense RNA-mediated IP3R repression. WEHI7.2 cells were transfected with empty vector (NeoMix) or vector expressing antisense RNA directed toward all three IP3R isoforms (ASMix), and mixed cell populations (i.e. non-clonal) were selected in G418. Cells were treated for 24 h with 0.1 μm dexamethasone prior to the following measurements. A, immunoblot documenting antisense RNA-mediated repression of basal and dexamethasone (DEX)-induced IP3R expression, representative of 10 experiments. B, cytoplasmic calcium concentration. Error bars represent the mean ± S.E. of three separate experiments. C, TG-induced calcium elevation. Error bars represent the mean ± S.E. of three separate experiments. D, cell viability (trypan blue exclusion). Error bars represent the mean ± S.E. of four experiments. E, apoptosis (sub-G1 DNA accumulation). Error bars represent the mean ± S.E. of four experiments. VEH, ethanol vehicle.
FIGURE 5.
FIGURE 5.
siRNA-mediated repression of all three IP3R isoforms. A, WEHI7.2 cells were transfected with siRNA SMARTpools for all three IP3R isoforms (IP3R TKD, triple knockdown of all three subtypes simultaneously) or a non-targeting SMARTpool (NT Pool) and subsequently treated for 24 h with 100 nm dexamethasone (DEX) or ethanol vehicle. The correct molecular mass band for IP3R2 (∼300 kDa) is the lower, sharper band, as indicated by the arrow. Findings are representative of 13 separate experiments. B, cytosolic (Cyt.) calcium and TG-releasable calcium were quantified in WEHI7.2 cells transfected with SMARTpools for all three IP3R subtypes simultaneously and treated for 24 h with 1 μm dexamethasone or ethanol vehicle (VEH). Error bars represent the mean ± S.E. of four experiments. C, apoptotic sensitivity to dexamethasone was compared between cells transfected with SMARTpools for all three IP3R subtypes simultaneously and cells transfected with a non-targeting SMARTpool. Cells were treated with 100 nm dexamethasone or ethanol vehicle for 24 or 48 h, and apoptosis was measured by flow cytometric quantification of sub-G1 DNA accumulation. Error bars represent the mean ± S.E. of four experiments.
FIGURE 6.
FIGURE 6.
siRNA-mediated repression of individual IP3R isoforms. A, WEHI7.2 cells were transfected with siRNA SMARTpools for IP3R1 (siR1), IP3R2 (siR2), and IP3R3 (siR3) or a non-targeting siRNA SMARTpool (siNT) as a negative control. Cells were treated for 24 h with 100 nm dexamethasone (DEX) or ethanol vehicle. Immunoblots show subtype-specific repression of each subtype. The correct molecular mass band for IP3R2 (∼300 kDa) is the lower, sharper band, as indicated by the arrow. Findings are representative of nine experiments. B, cytosolic calcium and TG-releasable calcium were quantified in cells transfected with SMARTpools for each subtype individually and treated for 24 h with 1 μm dexamethasone or ethanol vehicle (VEH). Error bars represent the mean ± S.E. of three experiments. Each comparison of cytosolic calcium elevation and decreased TG-releasable calcium between dexamethasone-treated and untreated cells was significant (p < 0.01). For dexamethasone-treated cells, each comparison of cytosolic calcium elevation and decreased TG-releasable calcium between non-targeting SMARTpool (NT) and SMARTpools for IP3R1 (R1), IP3R2 (R2), and IP3R3 (R3) was insignificant (p > 0.5). C, apoptotic sensitivity to dexamethasone was measured in cells transfected with SMARTpools for each subtype individually. Cells were treated with 100 nm dexamethasone or ethanol vehicle for 24 or 48 h, and apoptosis was measured by flow cytometric quantification of sub-G1 DNA accumulation. Error bars represent the mean ± S.E. of three experiments. In each comparison the dexamethasone-mediated increase in apoptosis was significant (p < 0.01), but in each case knocking down an individual IP3R subtype failed to inhibit apoptosis (p > 0.5).
FIGURE 7.
FIGURE 7.
DT40 cells lacking all three IP3R isoforms are not more resistant to dexamethasone-induced apoptosis than wild-type DT40 cells. A, wild-type DT40 cells were treated with (black bars) or without (white bars)1 μm dexamethasone (DEX), and cells were counted 24, 48, 72, and 96 h after treatment. The percentage of viable cells remained ∼100% in both treated and untreated cells at each time point. This experiment is representative of seven independent experiments. VEH, ethanol vehicle. B, a [3H]dexamethasone binding assay was performed on WEHI7.2 cells, wild-type DT40 (WT) cells, and DT40 cells that lacked all three IP3R subtypes (IP3R TKO). Specific binding is expressed in cpm. Error bars represent the mean ± S.E. (n = 3). C, DT40 wild-type cells and IP3R TKO cells were transfected with GFP or GR-GFP, as indicated, as well as the pTAT3-Luc firefly luciferase reporter plasmid and the phRG-TK Renilla luciferase control plasmid. 24 h following transfection, cells were treated with 1μm dexamethasone for 18 h, and Dual-Luciferase reporter assays were performed on the cells. TAT3 promoter activity is expressed as firefly luciferase luminescence divided by Renilla luciferase luminescence. Error bars represent the mean ± S.E. (n = 4). D, DT40 wild-type and IP3R TKO cells were transfected with GFP or GR-GFP, as indicated, and cells were treated with 1 μm dexamethasone. Apoptosis was assessed at 72 h by quantifying sub-G1 DNA accumulation by live cell flow cytometry and gating on GFP-positive cells. Error bars represent the mean ± S.E. (n = 3).

References

    1. Rhen, T., and Cidlowski, J. A. (2005) N. Engl. J. Med. 353 1711–1723 - PubMed
    1. Ashwell, J. D., Lu, F. W., and Vacchio, M. S. (2000) Annu. Rev. Immunol. 18 309–345 - PubMed
    1. Jondal, M., Pazirandeh, A., and Okret, S. (2004) Trends Immunol. 25 595–600 - PubMed
    1. Distelhorst, C. W. (2002) Cell Death Differ. 9 6–19 - PubMed
    1. Wyllie, A. H. (1980) Nature 284 555–556 - PubMed

Publication types