. 2008 Apr;82(8):4016-27.
doi: 10.1128/JVI.02164-07. Epub 2008 Feb 13.

Antiviral therapy during primary simian immunodeficiency virus infection fails to prevent acute loss of CD4+ T cells in gut mucosa but enhances their rapid restoration through central memory T cells

Affiliations

Antiviral therapy during primary simian immunodeficiency virus infection fails to prevent acute loss of CD4+ T cells in gut mucosa but enhances their rapid restoration through central memory T cells

David Verhoeven et al. J Virol. 2008 Apr.

Abstract

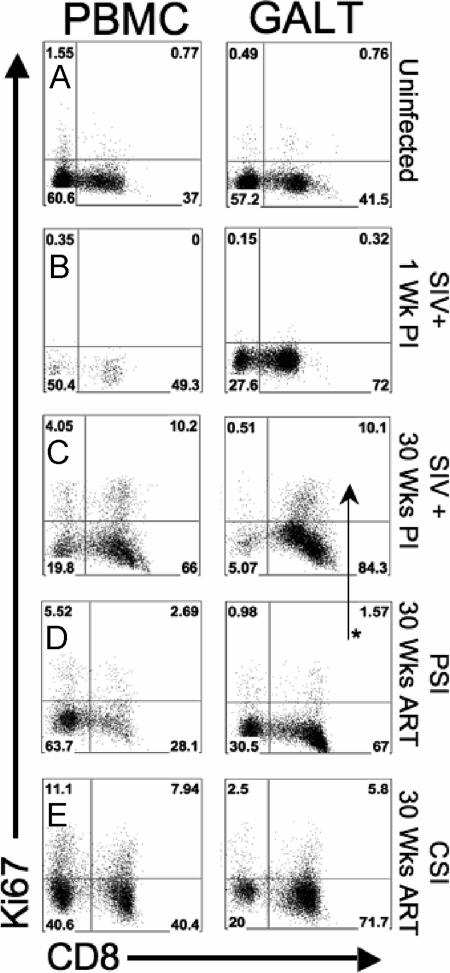
Gut-associated lymphoid tissue (GALT) is an early target of human immunodeficiency virus (HIV) and simian immunodeficiency virus (SIV) and a site for severe CD4+ T-cell depletion. Although antiretroviral therapy (ART) is effective in suppressing HIV replication and restoring CD4+ T cells in peripheral blood, restoration in GALT is delayed. The role of restored CD4+ T-cell help in GALT during ART and its impact on antiviral CD8+ T-cell responses have not been investigated. Using the SIV model, we investigated gut CD4+ T-cell restoration in infected macaques, initiating ART during either the primary stage (1 week postinfection), prior to acute CD4+ cell loss (PSI), or during the chronic stage at 10 weeks postinfection (CSI). ART led to viral suppression in GALT and peripheral blood mononuclear cells of PSI and CSI animals at comparable levels. CSI animals had incomplete CD4+ T-cell restoration in GALT. In PSI animals, ART did not prevent acute CD4+ T-cell loss by 2 weeks postinfection in GALT but supported rapid and complete CD4+ T-cell restoration thereafter. This correlated with an accumulation of central memory CD4+ T cells and better suppression of inflammation. Restoration of CD4+ T cells in GALT correlated with qualitative changes in SIV gag-specific CD8+ T-cell responses, with a dominance of interleukin-2-producing responses in PSI animals, while both CSI macaques and untreated SIV-infected controls were dominated by gamma interferon responses. Thus, central memory CD4+ T-cell levels and qualitative antiviral CD8+ T-cell responses, independent of viral suppression, were the immune correlates of gut mucosal immune restoration during ART.


Figures

FIG. 1.
FIG. 1.
Initiation of combination ART leads to viral suppression in plasma and GALT of SIV-infected rhesus macaques compared to untreated controls. (A) Plasma viral loads were measured by real-time PCR in untreated SIV+ animals, PSI animals (initiating ART at 1 week postinfection), and CSI animals (initiating ART at 10 weeks postinfection). Arrows indicate the time of the initiation of ART. (B) Viral RNA loads in GALT of untreated SIV+ controls and PSI and CSI animals were determined by real-time PCR. Viral loads were calculated based on SIV copies per μg of total tissue RNA (mean ± standard error; n = 5 for each group). The level of detection was 200 SIV copies per μg of total tissue RNA. The dotted lines indicate the level of detection of SIV RNA copies. Asterisks indicate statistically significant differences between PSI and CSI groups and between PSI and untreated controls (P < 0.05) at the indicated time points.
FIG. 2.
FIG. 2.
Full restoration of CD4+ T cells in GALT of SIV-infected animals starting ART during acute SIV infection. Longitudinal samples of peripheral blood (A) and GALT (B) were obtained from PSI and CSI animals and untreated SIV+ controls. The CD4+ T-cell counts or percentages were determined by flow cytometric analysis (mean ± standard error; n = 5 in each group). Asterisks indicate statistically significant differences between PSI and CSI groups and between PSI and untreated controls (P < 0.05) at the indicated time points.
FIG. 3.
FIG. 3.
The CD4+ T cells in GALT are comprised of central memory cells, effector memory cells, and an intermediate population. Flow cytometric analysis of isolated mononuclear cells from the GALT of uninfected rhesus macaques was performed by gating on live cells and CD3 along with doublet discrimination. CD4+ T cells were then forward gated, showing percentage that express CCR7/CD28, CD95/CD28, CD27/CD28, CD25/CD8, and Ki-67/CD28. A representative animal from the uninfected control group is shown (n = 5).
FIG. 4.
FIG. 4.
Early restoration of central memory CD4+ T cells in GALT leads to enhanced gut mucosal CD4+ T-cell restoration during therapy. Flow cytometric analysis was performed to identify memory CD4+ T-cell subsets in GALT, and data are presented for a representative animal from each experimental group. (A) Uninfected healthy control; (B) SIV-infected therapy-naïve animal at 30 weeks postinfection; (C) CSI animal after 16 weeks of ART; (D) PSI animal after 16 weeks of ART; (E) CSI animal after 30 weeks of ART; (F) PSI animal after 30 weeks of ART. Asterisks indicate statistically significant differences between PSI and CSI groups for the memory subsets (P < 0.05). Numbers next to asterisks indicate corresponding time points that are significant.
FIG. 5.
FIG. 5.
SIV antigen-specific CD8+ T-cell responses in GALT of SIV-infected rhesus macaques. (A) Longitudinal analysis of SIV gag-specific CD8+ T-cell responses in GALT was performed in SIV-infected therapy-naïve controls and PSI and CSI animals during therapy. Intracellular cytokine responses (IL-2 and IFN-γ) were measured by flow cytometry, and the percentages of SIV gag-specific CD8+ T cells are presented at different time points postinfection or during ART. (B) The functional composition of the SIV-specific CD8+ T-cell responses, showing every possible combination of responses (TNF-α, IL-2, and IFN-γ) after 30 weeks of ART (PSI and CSI) or 30 weeks of infection (SIV+ untreated), is shown on the x axis of the bar graph. Bars indicate the percentages of total SIV gag response contributed by CD8+ T cells with a given functional response. The data are summarized in pie charts, in which each slice represents the fraction of the CD8+ T-cell response for each cytokine singly or in combination. (C) Flow cytometric analysis of the expression of CCR5 and CXCR4 was performed on GALT CD8+ T cells from uninfected, ART-naïve infected controls (30 weeks postinfection), PSI (after 30 weeks of ART), and CSI animals (30 weeks of ART). Data for a representative animal from each group are shown. Asterisks indicate statistically significant differences between PSI and CSI CD8+ T-cell responses and untreated SIV-infected controls (P < 0.05) or significant differences in the percentages of both CCR5+ and CCR5+ CXCR4+ CD8+ T cells in the PSI group compared to all other groups.
FIG. 6.
FIG. 6.
Proliferation of CD8+ T cells in GALT and peripheral blood of SIV-infected rhesus macaques during ART. Proliferative potential was measured by flow cytometry by gating on Ki-67+ CD8+ T cells of PBMC and GALT of uninfected healthy controls (A), ART-naïve SIV-infected controls at 1 week postinfection (B), ART-naïve SIV-infected controls at 30 weeks postinfection (C), PSI animals at 30 weeks of ART (D), and CSI animals at 30 weeks postinfection (E). Data from a representative animal are shown. The asterisk marks a statistically significant difference in the percentage of proliferating CD8+ T cells (P < 0.05).
FIG. 7.
FIG. 7.
Suppression of intestinal inflammation correlates with gut mucosal CD4+ T-cell restoration during ART. (A) Intestinal inflammation was assessed by measuring inflammation-associated gene expression (phospholipase A2 [PLA2], PAP, TGF-β, TNF-α [TNFA], IL-8, and MIG) by real-time PCR. To demonstrate the magnitude of the difference between CSI and PSI groups, the ratio of the fold change of CSI over PSI is shown for each gene at various time points, with baseline levels of each gene derived from uninfected controls subtracted from both PSI and CSI averages. (B) An increase in expression of inflammation-associated genes was detected in PSI animals (30 weeks ART), CSI animals (30 weeks ART), and untreated SIV-infected controls (30 weeks postinfection [PI]) by comparison with the baseline values from uninfected healthy controls. (C) A Western blot analysis showed the change in protein levels of glucose response protein 78 (GRP-78) in GALT of PSI and CSI animals at 30 weeks of ART compared to SIV+ therapy-naïve controls at 30 weeks postinfection.

Comment in

References

    1. Abel, K., D. M. Rocke, B. Chohan, L. Fritts, and C. J. Miller. 2005. Temporal and anatomic relationship between virus replication and cytokine gene expression after vaginal simian immunodeficiency virus infection. J. Virol. 7912164-12172. - PMC - PubMed
    1. Agace, W. W., A. I. Roberts, L. Wu, C. Greineder, E. C. Ebert, and C. M. Parker. 2000. Human intestinal lamina propria and intraepithelial lymphocytes express receptors specific for chemokines induced by inflammation. Eur. J. Immunol. 30819-826. - PubMed
    1. Akerele, T., G. Galatowicz, C. Bunce, V. Calder, W. A. Lynn, and S. Lightman. 2006. Normalized CD8+ but not CD4+ lymphocyte IL-2 expression is associated with early treatment with highly active antiretroviral therapy. Clin. Immunol. 121191-197. - PubMed
    1. Amyes, E., A. J. McMichael, and M. F. Callan. 2005. Human CD4+ T cells are predominantly distributed among six phenotypically and functionally distinct subsets. J. Immunol. 1755765-5773. - PubMed
    1. Betts, M. R., B. Exley, D. A. Price, A. Bansal, Z. T. Camacho, V. Teaberry, S. M. West, D. R. Ambrozak, G. Tomaras, M. Roederer, J. M. Kilby, J. Tartaglia, R. Belshe, F. Gao, D. C. Douek, K. J. Weinhold, R. A. Koup, P. Goepfert, and G. Ferrari. 2005. Characterization of functional and phenotypic changes in anti-Gag vaccine-induced T cell responses and their role in protection after HIV-1 infection. Proc. Natl. Acad. Sci. USA 1024512-4517. - PMC - PubMed

Publication types

MeSH terms