. 2008 May 15;111(10):4854-61.
doi: 10.1182/blood-2007-08-105247. Epub 2008 Feb 13.

Dynamic imaging of fibrin network formation correlated with other measures of polymerization

Affiliations

Dynamic imaging of fibrin network formation correlated with other measures of polymerization

Irina N Chernysh et al. Blood. .

Abstract

Using deconvolution microscopy, we visualized in real time fibrin network formation in the hydrated state. Individual mobile fibers were observed before the gel point determined by eye. After gelation, an initial fibrin network was seen, which evolved over time by addition of new fibers and elongation and branching of others. Furthermore, some fibers in the network moved for a time. We quantified network formation by number of branch points, and longitudinal and lateral growth of fibers. Eighty percent of branch points were formed, and 70% of all fibers reached their maximum length at the gel point. In contrast, at the gel point, fiber diameter, measured as fluorescence intensity, was less than 25% and turbidity was less than 15% of the maximum values of the fully formed clot. The cumulative percentage of fibers reaching their final length and the number of branch points attained maximum values at 60% of maximum turbidity. Lateral fiber growth reached a plateau at the same time as turbidity. Measurements of clot mechanical properties revealed that the clots achieved maximum stiffness and minimum plasticity after the structural parameters reached their maxima. These results provide new information on the relative time sequence of events during fibrin network formation.


Figures

Figure 1
Figure 1
Series of micrographs from the deconvolution microscope showing the dynamics of fibrin network formation. Fibrin was labeled with Alexa 488 as described in “Labeling of fibrinogen with Alexa 488.” Images were taken every 10 seconds (Videos S1,S2, available on the Blood website; see the Supplemental Materials link at the top of the online article). Selected images at the following times are shown: (A) 3 minutes and 50 seconds, (B) 4 minutes, (C) 4 minutes and 10 seconds, (D) 4 minutes and 20 seconds, (E) 4 minutes and 40 seconds, (F) 5 minutes, (G) 6 minutes, and (H) 20 minutes. Arrowheads (➤) indicate new fibers. Thick arrows (↙) indicate fibers that change position. Thin arrows (↑) indicate fibers that change length. The circled area shows a single-fiber with a branch point that is not connected to the scaffold in panel D, but it has connected to the scaffold later, as in panel E. Bar represents 15 μm.
Figure 2
Figure 2
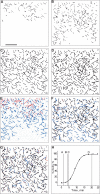
Images of real-time series of fibrin network formation. The images of a low-magnification time series of micrographs were thresholded and colorized as described in “Establishment of the scaffold and network formation.” Original images from a similar time course of polymerization are shown in Videos S1,S2. (A) First fibers appear, corresponding to the lag period of the turbidity curve. (B) The scaffold appears, corresponding to the time when the turbidity curve starts increasing. (C) Corresponds to the gelation time measured by eye. (D) Network is fully formed, corresponding to the time when the turbidity curve reached a plateau. (E) Represents merged panels A and B, where the panel A was colored red, and panel B blue. (F) Represents merged panels B and C, where panel B was colored red, and panel C blue. Fibers that have purple color (mixture of red and blue) represent the same fibers at the 2 time points. Fibers that have blue color represent newly formed fibers. Fibers that have red color are the fibers that changed position or were rearranged. (G) Represents merged panels C and D, where panel C was colored red, and panel D was blue. Purple fibers are the same fibers at the same positions, red fibers are rearranged fibers, and blue fibers are newly formed fibers. (H) Turbidity curve with marked time points A, B, C, D, each corresponding to the time point represented in panels A through D, respectively. Bar represents 40μm.
Figure 3
Figure 3
Dynamics of fibrin polymerization in terms of turbidity (◇), fluorescence intensity (□), number of branch points (▵), and fiber length (⬟). The error bars represent 1 standard deviation. Curves that represent branch point formation and length changes reach a plateau before lateral growth, which is represented by the fluorescent intensity curve. Lateral growth of fibrin fibers reached a plateau at the same time as the turbidity curve. ↓ shows the gel point measured by eye.
Figure 4
Figure 4
Dynamics of normalized fluorescence intensity of single-fibers. Each curve (▵, ●, ◆, □) represents a single-fiber. The kinetics of single-fiber assembly was different. The graph shows that polymerization of single-fibers reach a maximum intensity at different stages of network formation. The fluorescence intensity of single-fibers was measured and normalized by the maximum of intensity of each fiber. The first arrow (↓) shows the gel point measured by eye. The second arrow (↓) shows the time when turbidity curve reached a plateau.
Figure 5
Figure 5
Distribution of mature fibers. The rates of changes as a function of time of fluorescence intensity, longitudinal growth, and branch points. Turbidity (●), fluorescence intensity (■), number of branch points (▴), and fiber length (◆) were calculated for each time point. ↑ shows the gel point measured by eye. Distribution of mature fibers in term of longitudinal growth and branch point formation have a maximum at the same time that corresponds to the gel point measured by eye. The distribution of mature fibers in terms of fluorescence intensity has a maximum after longitudinal growth and branch point formation were completed. The software package Origin version 6 (OriginLab, Northampton, MA) was used to do the Gaussian fitting.
Figure 6
Figure 6
The cumulative fraction of mature fibers that have reached maximum (■) intensity, (◆) length, and (⬟) number of branch points compared with turbidity (▾) as a function of time. Curves that represent the cumulative fraction of mature fibers in terms of length and branch point formation have similar slopes and reached a plateau before turbidity reached a plateau. Curves that represent the cumulative fraction of mature fibers in terms of intensity have similar slopes with turbidity and reached a plateau at the same time. The software package Origin version 6 was used to do the sigmoid fitting.
Figure 7
Figure 7
Dynamics of the mechanical properties of a plasma clot was measured using a torsion pendulum. Samples for measurements were prepared as described in “Polymerization mixture and gel point measurement.” (A) Storage modulus (G′) or stiffness (■). (B) Loss modulus (G″) or inelastic component (■). (C) Tangent (δ = G″/G′) (■). (D) Turbidity (■). The error bars represent 1 standard deviation. G′ and G″, which represent stiffness and inelastic component, respectively, reached a plateau after polymerization was completed, as represented by turbidity curve. Tan δ, which is the ratio of G″ and G′, reached a plateau also after polymerization was completed.

Comment in

References

    1. Weisel JW. Fibrinogen and fibrin. Adv Protein Chem. 2005;70:247–299. - PubMed
    1. Doolittle RF. Fibrinogen and fibrin. Annu Rev Biochem. 1984;53:195–229. - PubMed
    1. Cierniewski CS, Kloczewiak M, Budzynski AZ. Expression of primary polymerization sites in the D domain of human fibrinogen depends on intact conformation. J Biol Chem. 1986;261:9116–9121. - PubMed
    1. Litvinov RI, Gorkun OV, Owen SF, Shuman H, Weisel JW. Polymerization of fibrin: specificity, strength, and stability of knob-hole interactions studied at the single-molecule level. Blood. 2005;106:2944–2951. - PMC - PubMed
    1. Weisel JW, Phillips GN, Jr, Cohen C. The structure of fibrinogen and fibrin: II, architecture of the fibrin clot. Ann N Y Acad Sci. 1983;408:367–379. - PubMed

Publication types