. 2008 May;3(3):720-8.
doi: 10.2215/CJN.03630807. Epub 2008 Feb 13.

Impact of uremia, diabetes, and peritoneal dialysis itself on the pathogenesis of peritoneal sclerosis: a quantitative study of peritoneal membrane morphology

Affiliations

Impact of uremia, diabetes, and peritoneal dialysis itself on the pathogenesis of peritoneal sclerosis: a quantitative study of peritoneal membrane morphology

Kazuho Honda et al. Clin J Am Soc Nephrol. 2008 May.

Abstract

Background and objectives: Peritoneal interstitial fibrosis and hyalinizing vasculopathy were induced by peritoneal dialysis and other associated conditions (e.g., uremia). A quantitative method for peritoneal biopsy evaluation is required to investigate possible causative factors and severity of the peritoneal dialysis-related peritoneal alterations.

Design, setting, participants, & measurements: Peritoneal biopsy specimens from 173 uremic (before peritoneal dialysis) and 80 peritoneal dialysis patients with or without impaired ultrafiltration capacity were evaluated by average peritoneal thickness of submesothelial compact zone measured at five randomly selected points of peritoneum and by lumen/vessel diameter ratio at postcapillary venule.

Results: The average peritoneal thickness was increased in uremic patients and progressively thickened as the duration of peritoneal dialysis prolonged. The lumen/vessel diameter ratio was lower in uremia than normal and progressively decreased as the duration of peritoneal dialysis prolonged. In pre-peritoneal dialysis peritoneum, patients with diabetes showed significant decrease in lumen/vessel diameter ratio compared with patients without diabetes. The average peritoneal thickness was significantly higher in patients with impaired ultrafiltration capacity than in patients with maintained ultrafiltration capacity; however, no significant difference was observed in the postcapillary venule thickness and lumen/vessel diameter ratio between the two groups.

Conclusions: The average peritoneal thickness and lumen/vessel diameter ratio were useful morphologic parameters to quantify the severity of the peritoneal alterations in uremic and peritoneal dialysis patients. Uremia and diabetes had an impact on the pathogenesis of peritoneal sclerosis in pre-peritoneal dialysis peritoneum. Peritoneal dialysis treatment itself had a much stronger impact on the progression of peritoneal sclerosis.


Figures

Figure 1.
Figure 1.
Adequacy of the samples for evaluation of peritoneal thickness (A) and vasculopathy (B). (A) By observation of 253 peritoneal samples, 71 samples from the 173 pre–peritoneal dialysis (pre-PD) patients and 40 samples from the 80 PD patients were adequate for the evaluation of peritoneal thickness. (B) For the evaluation of vasculopathy, adequate specimen must contain postcapillary venules (PCV) at the level of 25 to 50 μm in external diameter. By observation of the 253 peritoneal samples, 139 samples from the 173 pre-PD patients and 76 samples from the 80 PD patients were adequate for the evaluation of vasculopathy.
Figure 2.
Figure 2.
Average peritoneal thickness (APT) by five-point measurement method. The peritoneal thicknesses at randomly selected five points were measured, and then the APT was calculated. In this PD patient, the peritoneal thicknesses ranged from 123 to 435 μm, and the APT was 313.4 μm. The average of two APT values determined by two examiners was taken as a representative APT of that case.
Figure 3.
Figure 3.
Quantitative evaluation of vasculopathy at PCV. For evaluation of the severity of luminal narrowing, a ratio of luminal diameter to vessel diameter (L/V) was determined, representing the extent of patency of the blood vessel. The PCV whose diameter ranged from 25 to 50 μm was selected for the measurement. The distance is measured in short axis. The most severely affected vessel was chosen for the measurement. The average of two L/V values determined by two examiners was taken as the representative L/V of that case.
Figure 4.
Figure 4.
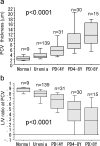
Comparison of APT among normal, uremic, and PD peritoneums. The APT of each category were 62.4 ± 52.0 μm in normal peritoneums (n = 9), 120.0 ± 84.4 μm in uremic (pre-PD) peritoneums (n = 71), 166.3 ± 101.7 μm in peritoneums of PD <4 yr (n = 15), 261.9 ± 97.0 μm in peritoneums of PD 4 to 8 yr (n = 15), and 466.6 ± 190.1 μm in peritoneums of PD >8 yr (n = 10), showing significant difference (P < 0.0001, Kruskal-Wallis).
Figure 5.
Figure 5.
Comparison of hyalinizing vasculopathy among normal, uremic, and PD peritoneums. (A) The vascular wall thickness at PCV was 2.32 ± 0.90 μm in normal peritoneums, 3.71 ± 1.96 μm in uremic (pre-PD) peritoneums, 6.59 ± 5.12 μm in peritoneums of PD <4 yr, 9.88 ± 5.64 μm in peritoneums of PD 4 to 8 yr, and 11.91 ± 5.22 μm in peritoneums of PD >8 yr, showing significant difference (P < 0.0001, Kruskal-Wallis). (B) The L/V at PCV also changed significantly: 0.872 ± 0.048 in normal peritoneums, 0.770 ± 0.122 in uremic (pre-PD) peritoneums, 0.630 ± 0.213 μm in peritoneums of PD <4 yr, 0.441 ± 0.274 μm in peritoneums of PD 4 to 8 yr and 0.301 ± 0.274 μm in peritoneums of PD >8 yr, showing significant difference (P < 0.0001, Kruskal-Wallis).
Figure 6.
Figure 6.
Comparison of peritoneal sclerosis in uremic (pre-PD) peritoneums between patients with and without diabetes. (A) The APT was higher in uremic (pre-PD) patient with diabetes (147.9 ± 107.0 μm; n = 22) than in patients without diabetes (107.0 ± 69.6 μm; n = 49) but not significantly. (B) The average PCV thickness was higher in uremic (pre-PD) patients with diabetes (4.76 ± 2.64 μm; n = 46) than in patients without diabetes (3.24 ± 1.22 μm; n = 90) significantly (P = 0.0009). (C) The L/V was decreased in uremic (pre-PD) patients with diabetes (0.708 ± 0.164; n = 46) compared with patients without diabetes (0.799 ± 0.079; n = 90; P = 0.0018).
Figure 7.
Figure 7.
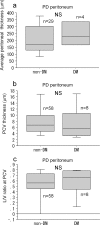
Comparison of peritoneal sclerosis between PD patients (<10 yr) with and without diabetes. (A) The APT was not different between PD patients without (212.08 ± 109.22 μm; n = 29) and with diabetes (250.62 ± 104.43 μm; n = 4). (B) The average PCV thickness was not different between PD patients without (8.23 ± 5.42 μm; n = 58) and with diabetes (7.65 ± 5.70 μm; n = 8). (C) The L/V was not different between PD patients without (0.528 ± 0.262; n = 58) and with diabetes (0.573 ± 0.273; n = 8).
Figure 8.
Figure 8.
Hyalinizing vasculopathy at PCV observed in a pre-PD (uremic) patient with diabetes. Hyalinizing vasculopathy at PCV was observed in the submesothelial interstitium (inset). The thickness of PCV was 12.1 μm, and L/V was 0.435. The peritoneum appeared broadly thickened continuous to subperitoneal dense connective tissue. The thickness of the peritoneum was unable to be measured in this case.
Figure 9.
Figure 9.
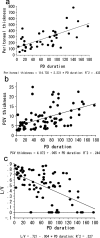
Correlation between PD duration and severity of peritoneal sclerosis in PD patients. (A) In PD patients, the APT was positively correlated with the PD duration, although its correlation coefficient was very low (y = 2.231x + 114.74, R2 = 0.433, n = 40; P < 0.0001). (B) There was a positive correlation between PCV thickness and PD duration (y = 0.064 x + 4.959, R2 = 0.243, n = 76; P < 0.0001). (C) There was an inverse correlation between L/V at PCV and PD duration (y = −0.004x + 0.721, R2 = 0.327, n = 76; P < 0.0001).
Figure 10.
Figure 10.
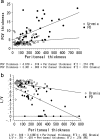
Correlation between peritoneal thickness and vasculopathy. (A) There was no significant correlation in uremic (pre-PD) patients (○; n = 63); however, a significant correlation was observed between APT and PCV thickness in PD patients (•; n = 38; y = 4.678x + 0.019, R2 = 0.274; P = 0.0005). (B) Similarly, a significant correlation was observed between APT and L/V in PD patients (•; n = 38; y = 0.701 to 0.001x, R2 = 0.274; P = 0.0005) but not in uremic (pre-PD) patients (○; n = 63).
Figure 11.
Figure 11.
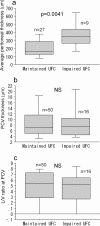
Comparison of peritoneal alterations between the patients with maintained and impaired ultrafiltration capacity (UFC). (A) The APT was significantly thicker in the group with impaired UFC (372.9 ± 182.2 μm, n = 9) than in the group with maintained UFC (211.0 ± 119.0 μm, n = 27; P = 0.0041). (B) The average PCV thickness was not different between the group with maintained UFC (9.24 ± 5.84 μm, n = 50) and the group with impaired UFC (9.22 ± 6.02 μm, n = 16). (C) The L/V at PCV was not different between the group with maintained UFC (0.489 ± 0.283, n = 50) and the group with impaired UFC (0.463 ± 0.290, n = 8).

References

    1. Di Paolo N, Sacchi G, De Mia M, Gaggiotti E, Capotondo L, Rossi P, Bernini M, Pucci AM, Ibba L, Sabatelli P, Alessandrini C: Morphology of the peritoneal membrane during continuous ambulatory peritoneal dialysis. Nephron 44: 204–211, 1986 - PubMed
    1. Gotloib L, Shostak A: Ultrastructural morphology of the peritoneum: New findings and speculations on transfer of solutes and water during peritoneal dialysis. Perit Dial Bull 7: 119–129, 1987
    1. Dobbie JW: Morphology of the peritoneum in CAPD. Blood Purif 7: 74–85, 1989 - PubMed
    1. Honda K, Nitta K, Horita S, Yumura W, Nihei H: Morphological changes in the peritoneal vasculature of patients on CAPD with ultrafiltration failure. Nephron 72: 171–176, 1996 - PubMed
    1. Mateijsen MA, van der Wal AC, Hendriks PM, Zweers MM, Mulder J, Struijk DG, Krediet RT: Vascular and interstitial changes in the peritoneum of CAPD patients with peritoneal sclerosis. Perit Dial Int 19: 517–525, 1999 - PubMed

Publication types