Comparative Study
. 2008 Feb;31(2):259-70.
doi: 10.1093/sleep/31.2.259.

Sleep-stabilizing effects of E-6199, compared to zopiclone, zolpidem and THIP in mice

Affiliations
Comparative Study

Sleep-stabilizing effects of E-6199, compared to zopiclone, zolpidem and THIP in mice

Chloé Alexandre et al. Sleep. 2008 Feb.

Abstract

Gamma aminobutyric acid (GABA)A receptor modulators constitute the majority of clinically used sedative-hypnotics. These compounds have the capacity to initiate and maintain sleep, but decrease REM sleep and delta activity within NREM sleep. In order to avoid such sleep adverse effects, the development of novel compounds remains of interest.

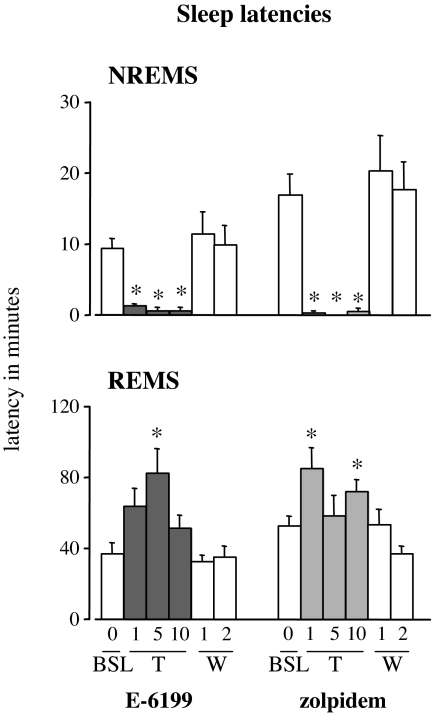
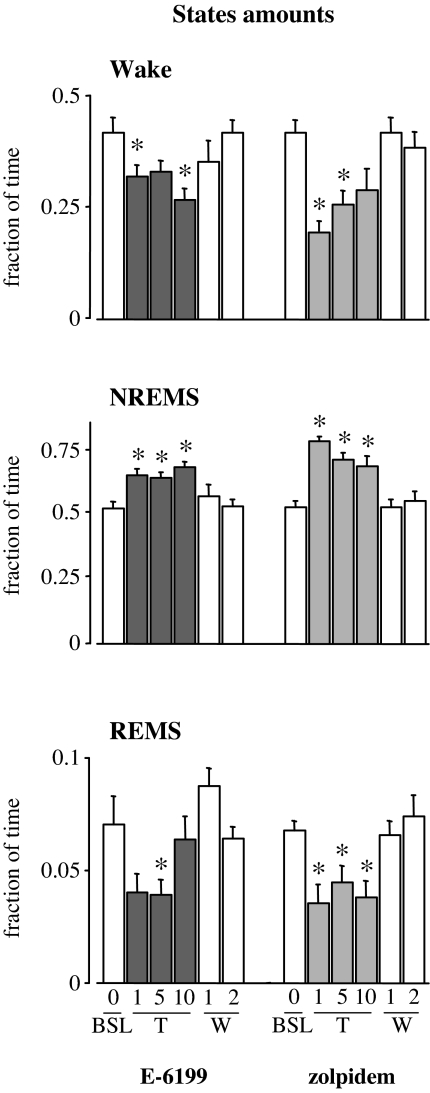
Study objectives: The present study aimed at characterizing the acute effects of a novel putative hypnotic compound, E-6199, compared to zopiclone, zolpidem, and THIP on sleep-wakefulness patterns in mice. We also investigated whether repeated administration (daily injection during 10 days) of E-6199 was associated with tolerance and sleep disturbances at cessation of treatment.

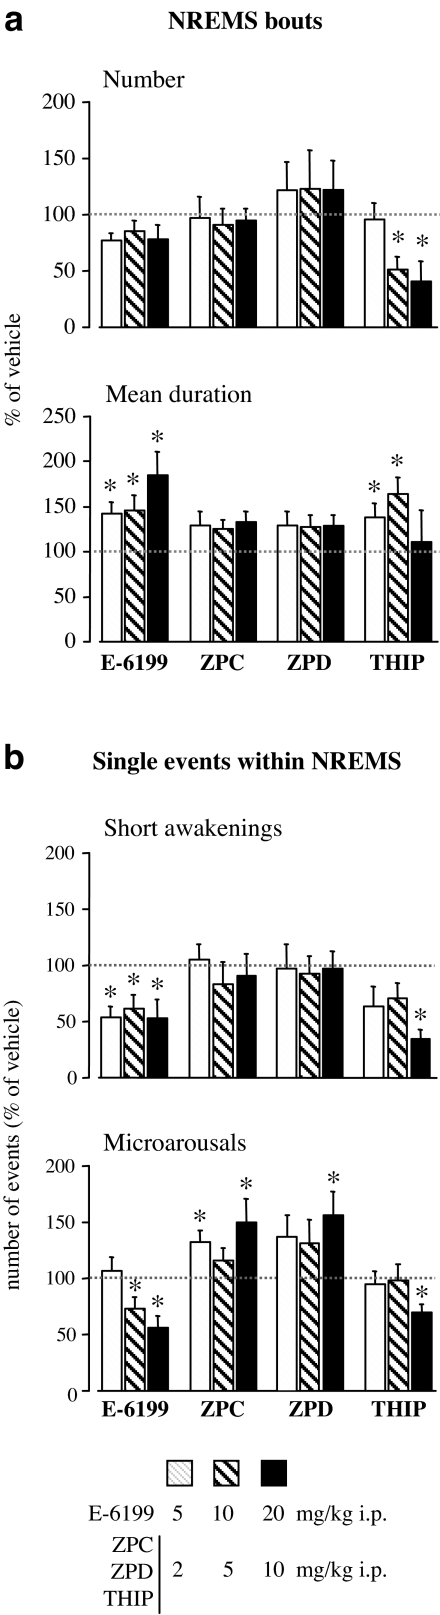
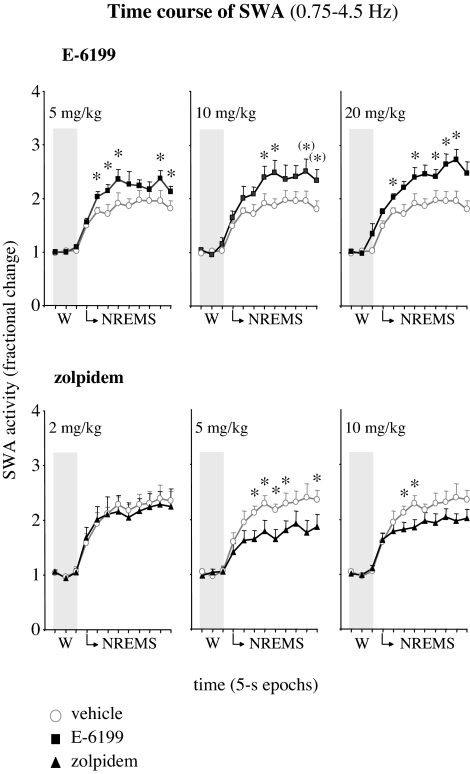
Measurements and results: Polygraphic recordings were performed during 8 h after acute treatment with the various compounds. Under such conditions, E-6199 (5-20 mg/kg i.p.), zopiclone and zolpidem (2-10 mg/kg i.p.), but not THIP (2-10 mg/kg i.p.), exerted a marked sleep-promoting effect. Furthermore, E-6199 specifically increased the duration of NREM and markedly improved sleep continuity by lengthening NREM sleep episodes and reducing short awakenings and microarousal frequency. It also intensified NREM sleep by enhancing the slow wave activity within NREM at wake-NREM transitions. These effects were sustained and became even larger during chronic administration. Finally, abrupt E-6199 withdrawal did not elicit negative sleep effects.

Conclusions: Our findings demonstrate that E-6199 may be an effective hypnotic compound that promotes and improves NREMS, without producing EEG side effects, tolerance or withdrawal phenomena, when administered under chronic conditions.


Figures

Figure 1
Figure 1
Chemical structure of E-6199 [4-(4-Methoxy-pyrimidin-2-yl)-piperazin-1-yl]-pyridin-2-yl-methanone].
Figure 2
Figure 2
NREMS and REMS latencies after acute treatment with E-6199, zopiclone (ZPC), zolpidem (ZPD) and THIP at various doses. Data (mean ± SEM of 7 to 9 animals per group; see Table 1) are expressed as minutes. * P < 0.05, significantly different from values obtained after injection of vehicle (0 on abscissa); paired Student's t-test.
Figure 3
Figure 3
Architecture of NREMS bouts after acute treatment with E-6199, zopiclone, zolpidem or THIP at various doses. a) Number and mean duration (an index of continuity) of all NREMS episodes. b) Occurrence of short awakenings and microarousals (MAs) within NREMS, as a measure of fragmentation. All data (mean ± SEM of 7 to 9 animals per group; see Table 1) are plotted for the first 2 h post-injection and are expressed as a percentage of the paired values obtained under vehicle conditions. * P < 0.05, significantly different from vehicle (100%); paired Student's t-test.
Figure 4
Figure 4
Dynamics of slow wave activity at W-NREMS transitions during the first 2 h after acute treatment with E-6199 or zolpidem at various doses. SWA (mean EEG power density in the 0.75–4.5 Hz band) was calculated in absolute values and is expressed relatively to mean power during preceding wakefulness. All NREMS episodes lasting at least 40 s were pooled for each animal. The curves connect mean 5-s epochs for 15 s before and 40 s after the transition from W to NREMS. * P < 0.05, significantly different from vehicle; (*) P < 0.01; paired Student's t-test.
Figure 5
Figure 5
EEG power density and slow wave activity (SWA) in NREMS during the first 2 h after acute treatment with E-6199 (20 mg/kg) and zolpidem (5 mg/kg). Curves connect mean values (mean ± SEM of 6 animals per group) of power density of each frequency bin expressed as percentage of the corresponding bin after vehicle treatment (100%). Values are plotted at the lower limit of each bin. Lines below the panels indicate frequency bins that differed from vehicle (P < 0.05; paired Student's t-test.). SWA (mean EEG power density 0.75–4.5 Hz) in NREMS, as an index of sleep intensity, is indicated in the histogram (right corner). Data (mean ± SEM of the same animals) are expressed as a percentage of the corresponding value under vehicle conditions. * P < 0.05, significantly different from vehicle (100%); (*) P < 0.01; paired Student's t-test.
Figure 6
Figure 6
NREMS and REMS latencies after repeated treatment with E-6199 (20 mg/kg) or zolpidem (5 mg/kg). Data (mean ± SEM of 8 animals per group) are expressed as minutes for the baseline (BSL), treatment (T1, T5 and T10) and drug withdrawal (W1 and W2) days. * P < 0.05, significantly different from BSL; paired Student's t-test
Figure 7
Figure 7
Amounts of the three vigilance states (W, NREMS and REMS) during the first 2 h after repeated treatment with E-6199 or zolpidem. The data (mean ± SEM of 8 animals per group) are expressed relative to recording time for the baseline (BSL), treatment (T1, T5, and T10) and drug withdrawal (W1 and W2) days. * P < 0.05, significantly different from BSL; paired Student's t-test.
Figure 8
Figure 8
Architecture of NREMS bouts after repeated treatment with E-6199 or zolpidem. a) Number and mean duration of all NREMS episodes. b) Occurrence of short awakenings and microarousals (MAs) within NREMS, as a measure of fragmentation. All data are plotted for the first 2 h post-injection at each day considered and expressed as a percentage of the paired values obtained under BSL conditions. * P < 0.05, significantly different from BSL (100%); paired Student's t-test.
Figure 9
Figure 9
Dynamics of slow wave activity at W-NREMS transitions during the first 2 h after repeated treatment with E-6199 or zolpidem. SWA (mean EEG power density in the 0.75–4.5 Hz band) was calculated in absolute values and is expressed relatively to mean power during preceding wakefulness. All NREMS episodes lasting at least 40 s were pooled for each animal. The curves connect mean 5-s epochs for 15 s before and 40 s after the transition from W to NREMS.* P < 0.05, significantly different from BSL; paired Student's t-test.

References

    1. Roth T, Drake C. Evolution of insomnia: current status and future direction. Sleep Med. 2004;5(Suppl 1):S23–30. - PubMed
    1. Sateia MJ, Nowell PD. Insomnia. Lancet. 2004;364:1959–73. - PubMed
    1. Lancel M. Role of GABAA receptors in the regulation of sleep: initial sleep responses to peripherally administered modulators and agonists. Sleep. 1999;22:33–42. - PubMed
    1. Wagner J, Wagner ML. Non-benzodiazepines for the treatment of insomnia. Sleep Med Rev. 2000;4:551–81. - PubMed
    1. Gottesmann C, Gandolfo G, Arnaud C, Gauthier P. The intermediate stage and paradoxical sleep in the rat: influence of three generations of hypnotics. Eur J Neurosci. 1998;10:409–14. - PubMed

Publication types