

Comparison of sleep parameters from actigraphy and polysomnography in older women: the SOF study
- PMID: 18274276
- PMCID: PMC2225568
- DOI: 10.1093/sleep/31.2.283
Comparison of sleep parameters from actigraphy and polysomnography in older women: the SOF study
Abstract
Study objectives: Total sleep time (TST), sleep efficiency (SE), and wake after sleep onset (WASO) as assessed by actigraphy gathered in 3 different modes were compared to polysomnography (PSG) measurements. Each mode was compared to PSG to determine which was more accurate. Associations of the difference in TST measurement with demographics and sleep characteristics were examined.
Design: Observational study.
Setting: Community-based.
Participants: Sixty-eight women (mean age 81.9 years) from the latest visit of the Study of Osteoporotic Fractures who were concurrently measured with PSG and actigraphy.
Interventions: N/A.
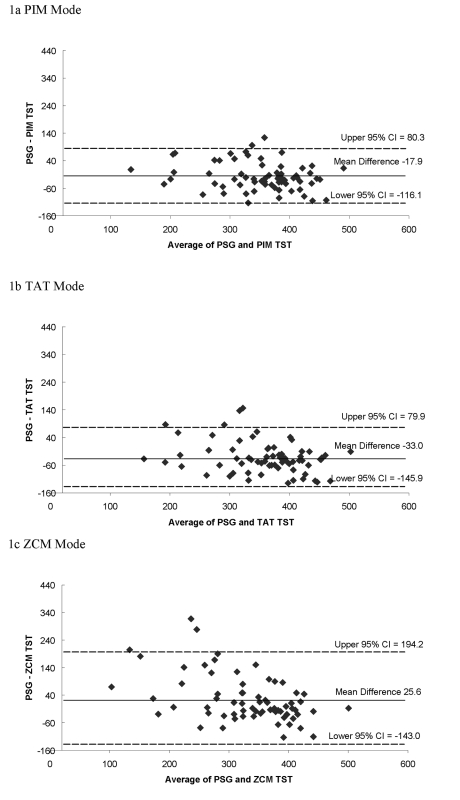
Measurements and results: In-home 12-channel PSG was gathered along with actigraphy data in 3 modes: proportional integration mode (PIM), time above threshold (TAT) and zero crossings mode (ZCM). The PIM mode corresponded better to PSG, with a mean overestimation of TST of 17.9 min. For the PIM mode, the estimation of TST and SE by PSG and actigraphy significantly differed (P < 0.01), while the estimation of WASO was similar (P = 0.27). The intraclass correlation between the 2 procedures was moderate to high (PIM mode: TST 0.76; SE 0.61; WASO 0.58). On average, the PIM mode underestimated TST by 68 min for those who slept < or = 5 hr, overestimated TST by 31 min for those with SE < 70%, and underestimated TST by 24 min for self-reported poor sleepers (P < 0.05).
Conclusions: Sleep parameters from actigraphy corresponded reasonably well to PSG in this population, with the PIM mode of actigraphy correlating highest. Those with poor sleep quality had the largest measurement error between the 2 procedures.
Figures
References
-
- Ancoli-Israel S, Cole R, Alessi CA, et al. The role of actigraphy in the study of sleep and circadian rhythms. Sleep. 2003;26:342–92. - PubMed
-
- Webster JB, Kripke DF, Messin S, Mullaney DJ, Wyborney G. An activity-based sleep monitor system for ambulatory use. Sleep. 1982;5:389–99. - PubMed
-
- Jean-Louis G, von Gizycki H, Zizi F, et al. Determination of sleep and wakefulness with the actigraph data analysis software (ADAS) Sleep. 1996;19:739–43. - PubMed
-
- Matsumoto M, Miyagishi T, Sack RL, Hughes RJ, Blood ML, Lewy AJ. Evaluation of the Actillume wrist actigraphy monitor in the detection of sleeping and waking. Psychiatry Clin Neurosci. 1998;52:160–1. - PubMed
-
- Jean-Louis G, Kripke DF, Cole RJ, Assmus JD, Langer RD. Sleep detection with an accelerometer actigraph: comparisons with polysomnography. Physiol Behav. 2001;72:21–8. - PubMed
Publication types
MeSH terms
Grants and funding
- R01 AG008415/AG/NIA NIH HHS/United States
- AG05407/AG/NIA NIH HHS/United States
- R01 AR035583/AR/NIAMS NIH HHS/United States
- R01 AR035584/AR/NIAMS NIH HHS/United States
- AG05394/AG/NIA NIH HHS/United States
- R01 AG005407/AG/NIA NIH HHS/United States
- AR35583/AR/NIAMS NIH HHS/United States
- R01 AR035582/AR/NIAMS NIH HHS/United States
- AR35584/AR/NIAMS NIH HHS/United States
- AR35582/AR/NIAMS NIH HHS/United States
- R01 AG026720/AG/NIA NIH HHS/United States
- AG08415/AG/NIA NIH HHS/United States
- R01 AG005394/AG/NIA NIH HHS/United States
