. 2008;3(2):330-9.
doi: 10.1038/nprot.2007.474.

Visualization of macromolecular complexes using cryo-electron microscopy with FEI Tecnai transmission electron microscopes

Affiliations

Visualization of macromolecular complexes using cryo-electron microscopy with FEI Tecnai transmission electron microscopes

Robert A Grassucci et al. Nat Protoc. 2008.

Abstract

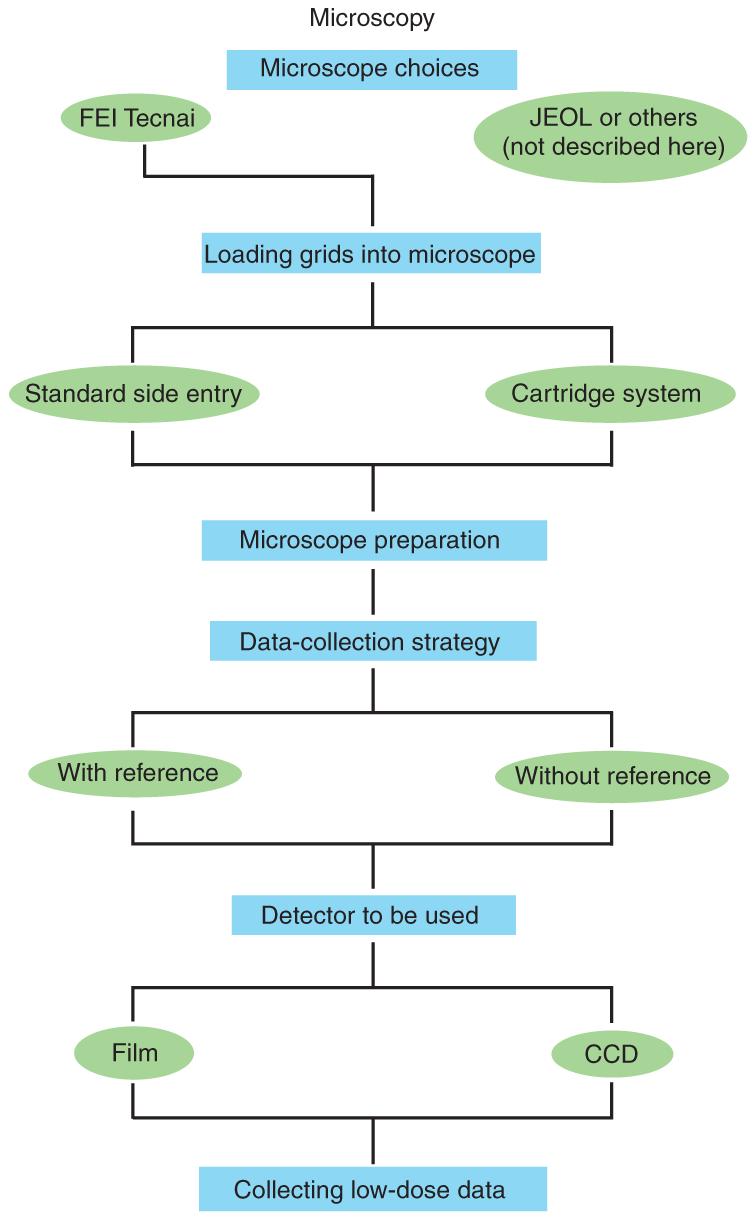
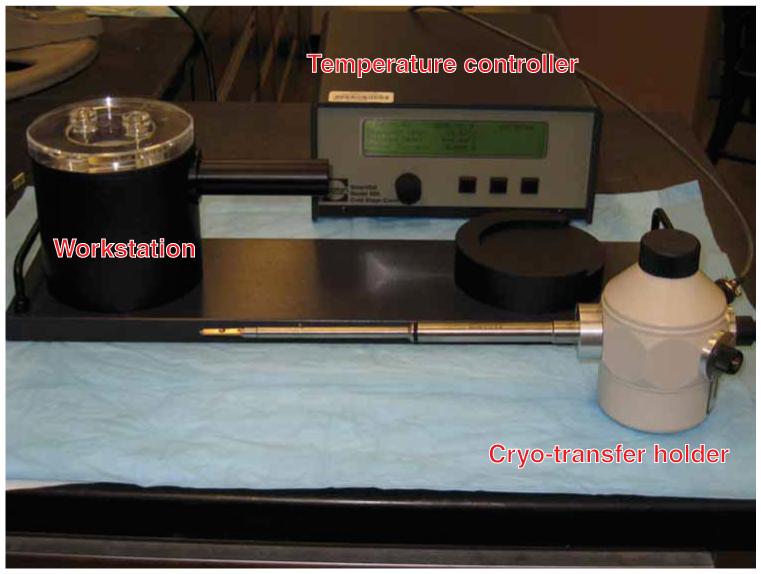
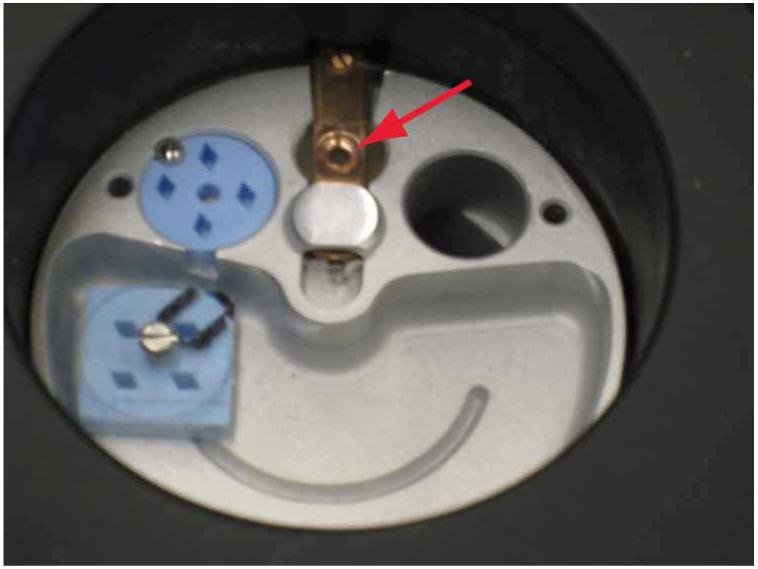
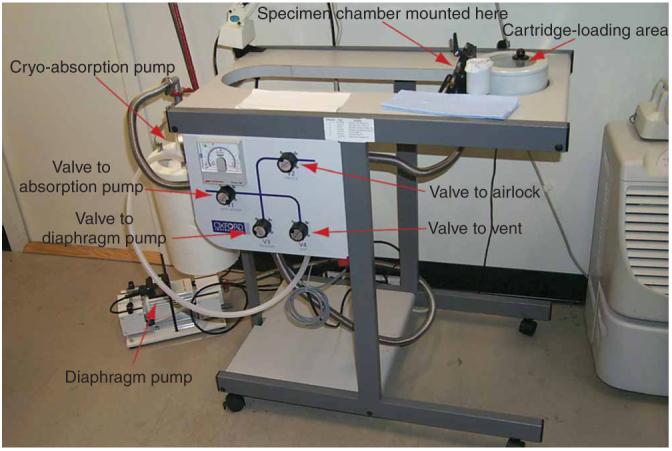
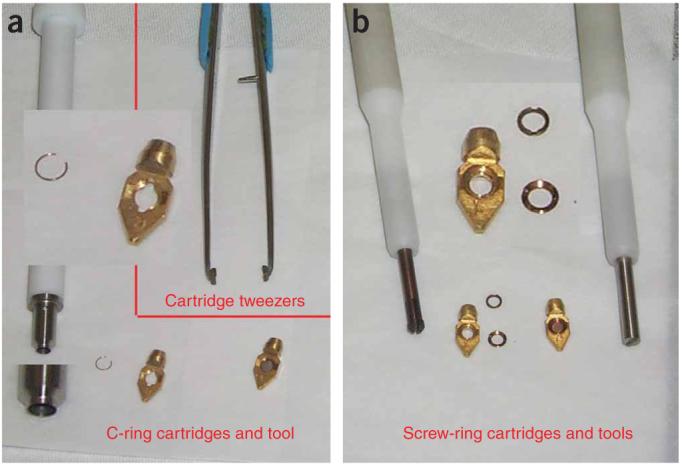
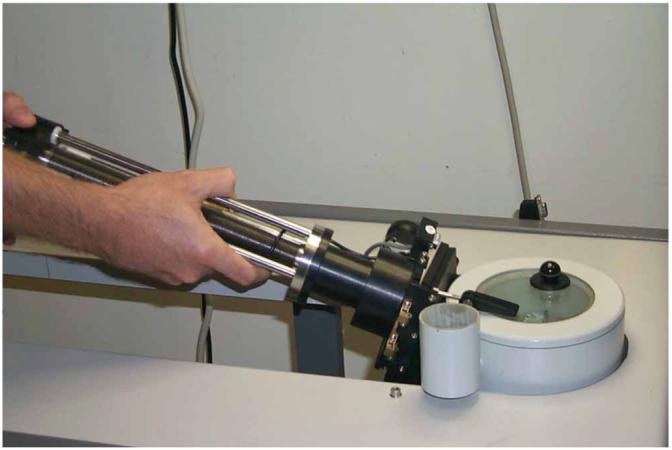
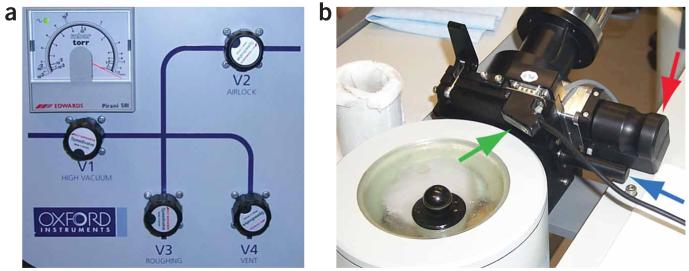
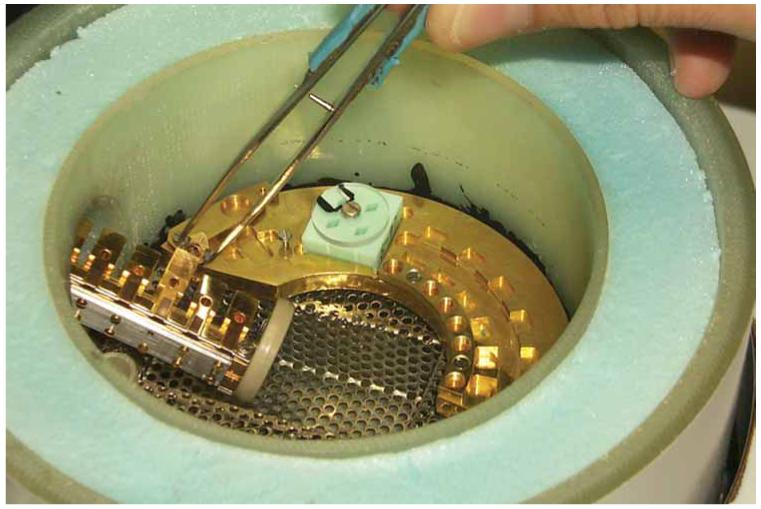
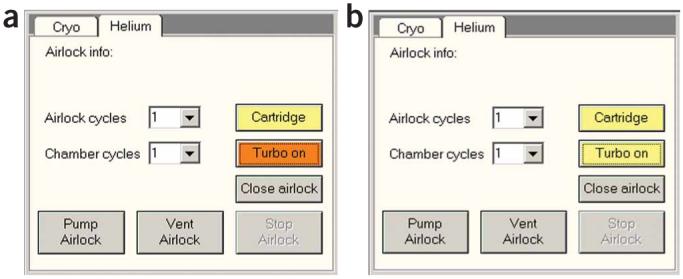
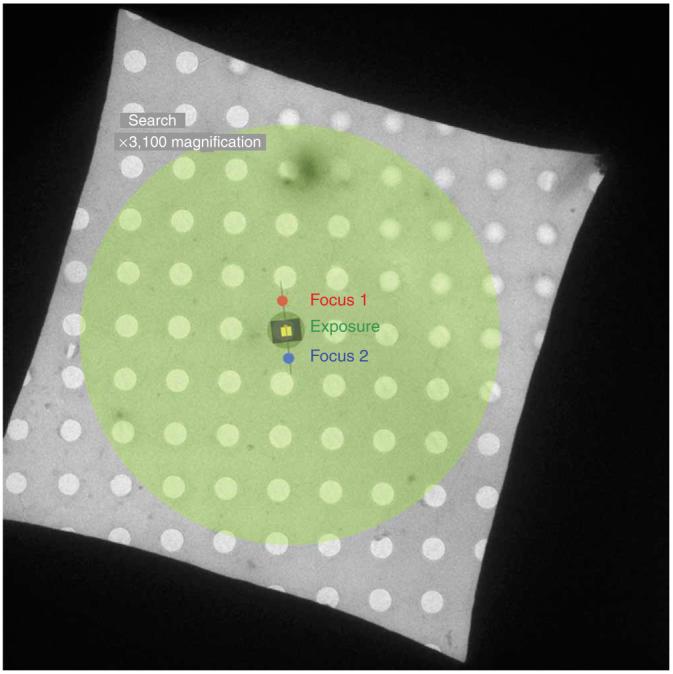
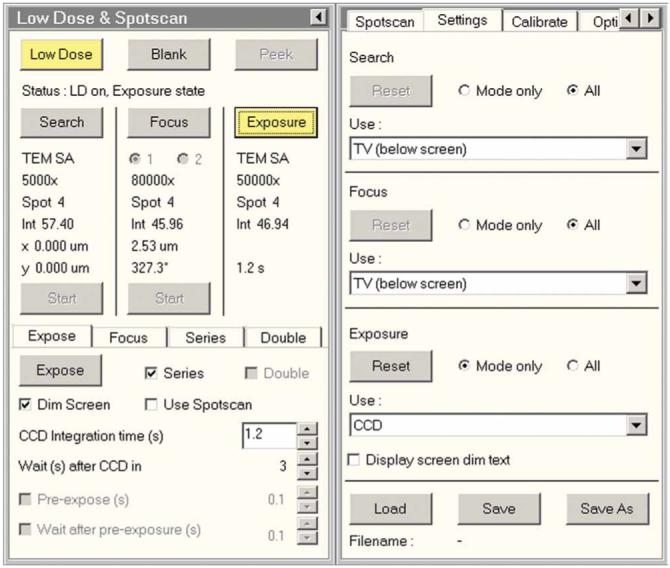
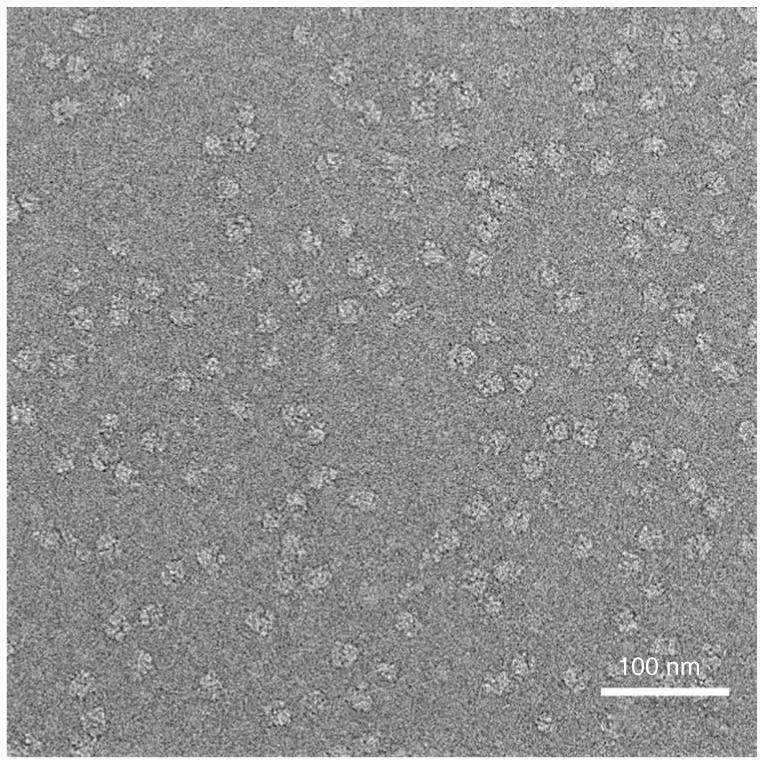
This protocol details the steps used for visualizing the frozen-hydrated grids as prepared following the accompanying protocol entitled 'Preparation of macromolecular complexes for visualization using cryo-electron microscopy.' This protocol describes how to transfer the grid to the microscope using a standard cryo-transfer holder or, alternatively, using a cryo-cartridge loading system, and how to collect low-dose data using an FEI Tecnai transmission electron microscope. This protocol also summarizes and compares the various options that are available in data collection for three-dimensional (3D) single-particle reconstruction. These options include microscope settings, choice of detectors and data collection strategies both in situations where a 3D reference is available and in the absence of such a reference (random-conical and common lines).


Figures

Figure 1
Figure 1
Schematic representation of steps in cryo-EM.
Figure 2
Figure 2
Cryo-transfer system overview. The components of the cryo-transfer system include the cryo-transfer holder, the transfer workstation and the temperature controller.
Figure 3
Figure 3
Cryo-transfer station. The tip of the cryo-transfer holder can be seen in the liquid-nitrogen-filled transfer vessel (red arrow). The box containing the frozen-hydrated grids is loaded into the station (blue boxes). The grid is transferred from the storage box to the cryo-holder in a liquid-nitrogen-cooled environment.
Figure 4
Figure 4
Polara transfer station overview: The labeled photo shows the individual parts of the transfer station.
Figure 5
Figure 5
Tools and cartridges. (a) Image shows the c-ring cartridges, the ring insertion tool and the special cartridge tweezers. (b) Image shows the screw-ring cartridges, the screw rings and the drivers used to secure the sample into the cartridges.
Figure 6
Figure 6
MSC being mounted on transfer station.
Figure 7
Figure 7
The transfer station. (a) Transfer station pumping block: various valves that are manipulated during venting and evacuation of MSC are shown. (b) MCS and transfer station valves. Red arrow indicates Va (MSC valve), blue arrow indicates gate valve (station valve) and green arrow indicates plug to release lock.
Figure 8
Figure 8
Transfer vessel with MSC inserted. The six ‘parking’ positions can be seen along with a cartridge being transferred into position 3 with the special cartridge tweezers (for more clear viewing, liquid nitrogen is not used in this image).
Figure 9
Figure 9
Turbo. (a) Waiting for turbo: vacuum UI Helium tab while turbo has not yet reached operating speed (orange color). (b) Turbo at operating speed: the turbo pump has reached operating speed (yellow color) and is ready for pumping. Reproduced with permission by FEI.
Figure 10
Figure 10
Diagram of grid square showing various low-dose areas. The areas exposed during the various low-dose modes are represented by colored circles on the EM grid square. Search mode (large green circle) is obtained at approximately ×3,000 magnification to minimize electron dose. Focus mode (red and blue circles) is off-axis and performed at about ×100,000 magnification. Exposure mode (dark green circle covering the center hole) is commonly taken at ×39,000-×100,000 when data are collected. The black rectangle represents the area covered by film and the yellow square represents the area covered by a 4KX4K CCD camera.
Figure 11
Figure 11
Low-dose UI. The low-dose program is activated by clicking on the ‘low-dose’ button. The yellow color of the button indicates that the low-dose program is active. Detector selection is available in the right half of the UI. Reproduced with permission by FEI.
Figure 12
Figure 12
Micrograph of ribosomes in vitreous ice. The micrograph shows an even particle distribution of ribosomes on a frozen-hydrated grid. Note that contrast has been inverted for subsequent image processing.

References

    1. Grassucci RA, Taylor DJ, Frank J. Preparation of macromolecular complexes for cryo-electron microscopy. Nat. Protoc. 2007;2:3239–3246. - PMC - PubMed
    1. Frank J. Three-Dimensional Electron Microscopy of Macromolecular Assemblies: Visualization of Biological Molecules in Their Native State. Oxford University Press; New York: 2006.
    1. Dubochet J, Lepault J, Freeman R, Berriman JA, Homo J-C. Electron microscopy of frozen water and aqueous solutions. J. Microsc. 1982;128:219–237.
    1. Wagenknecht T, Carazo JM, Radermacher M, Frank J. Three-dimensional reconstruction of the ribosome from Escherichia coli. Biophys. J. 1989;55:455–464. - PMC - PubMed
    1. Spahn CM, et al. Hepatitis C virus IRES RNA-induced changes in the conformation of the 40S ribosomal subunit. Science. 2001;291:1959–1962. - PubMed

Publication types

MeSH terms

Substances