. 2008 Mar;118(3):1074-84.
doi: 10.1172/JCI33187.

Leukocyte analysis from WHIM syndrome patients reveals a pivotal role for GRK3 in CXCR4 signaling

Affiliations

Leukocyte analysis from WHIM syndrome patients reveals a pivotal role for GRK3 in CXCR4 signaling

Karl Balabanian et al. J Clin Invest. 2008 Mar.

Abstract

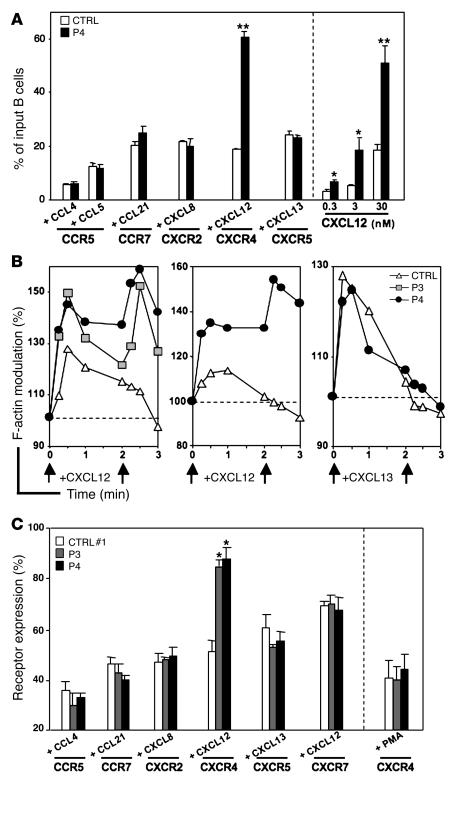
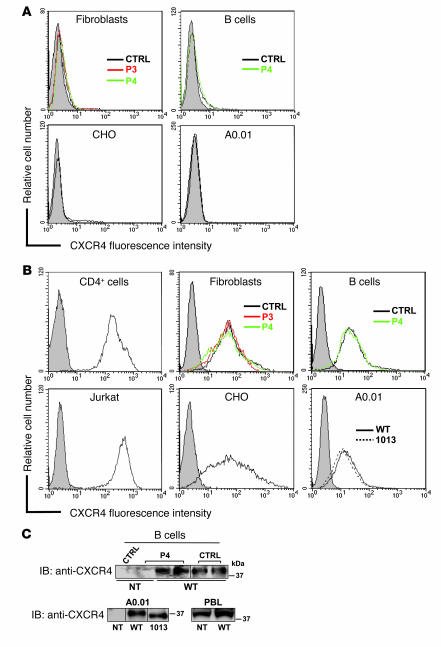
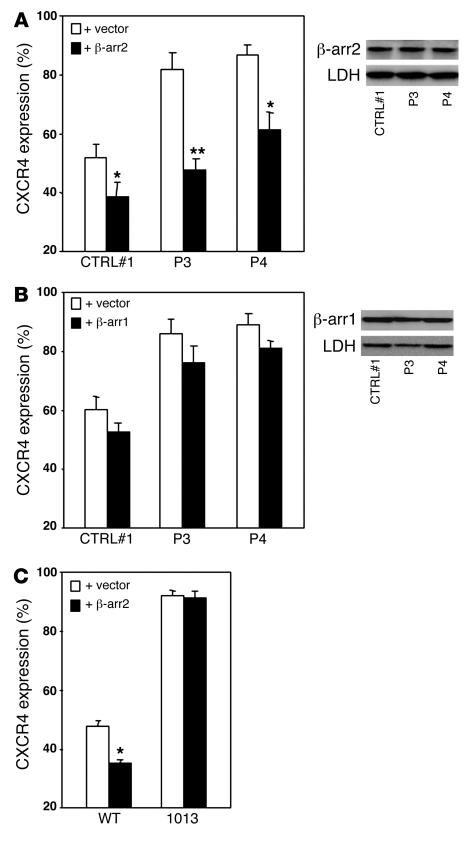
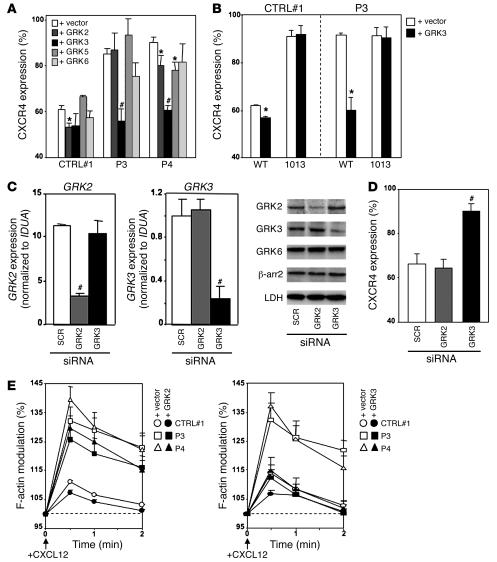
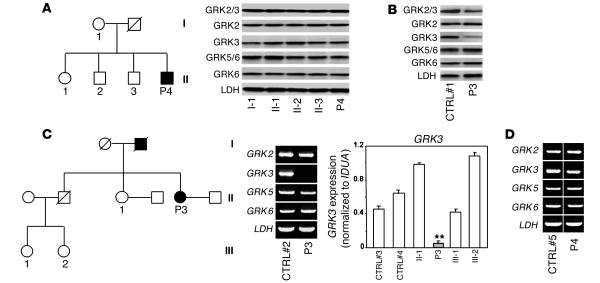
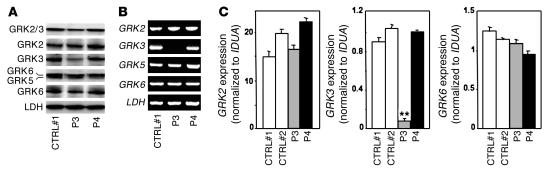
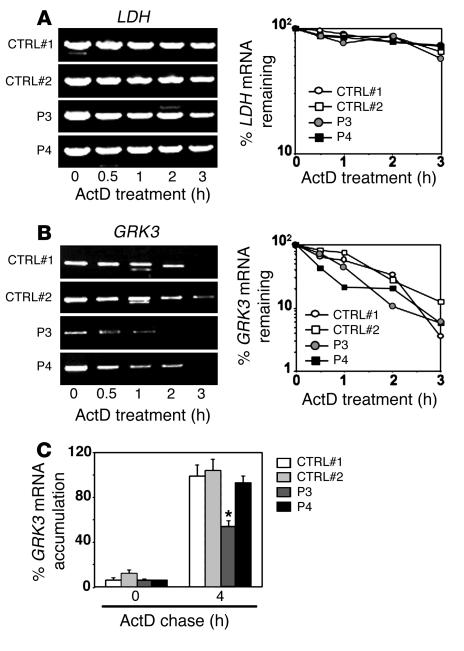
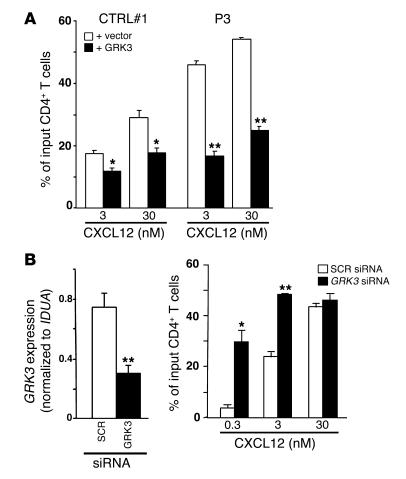
Leukocytes from individuals with warts, hypogammaglobulinemia, infections, and myelokathexis (WHIM) syndrome, a rare immunodeficiency, and bearing a wild-type CXCR4 ORF (WHIM(WT)) display impaired CXCR4 internalization and desensitization upon exposure to CXCL12. The resulting enhanced CXCR4-dependent responses, including chemotaxis, probably impair leukocyte trafficking and account for the immunohematologic clinical manifestations of WHIM syndrome. We provided here evidence that GPCR kinase-3 (GRK3) specifically regulates CXCL12-promoted internalization and desensitization of CXCR4. GRK3-silenced control cells displayed altered CXCR4 attenuation and enhanced chemotaxis, as did WHIM(WT) cells. These findings identified GRK3 as a negative regulator of CXCL12-induced chemotaxis and as a candidate responsible for CXCR4 dysfunction in WHIM(WT) leukocytes. Consistent with this, we showed that GRK3 overexpression in both leukocytes and skin fibroblasts from 2 unrelated WHIM(WT) patients restored CXCL12-induced internalization and desensitization of CXCR4 and normalized chemotaxis. Moreover, we found in cells derived from one patient a profound and selective decrease in GRK3 products that probably resulted from defective mRNA synthesis. Taken together, these results have revealed a pivotal role for GRK3 in regulating CXCR4 attenuation and have provided a mechanistic link between the GRK3 pathway and the CXCR4-related WHIM(WT) disorder.


Figures

Figure 2
Figure 2. Selective alteration of CXCR4 functioning in WHIMWT cells.
(A) EBV-B cells from CTRL and P4 individuals were nucleoporated with 5 μg of plasmids encoding CCR5, CCR7, CXCR2, CXCR4, or CXCR5 cDNA and assayed 15 h after transfection for chemotaxis using a Transwell system in response to the cognate chemokine (left section). Concentration-dependent migration of B cells expressing CXCR4 is shown in response to CXCL12 (right section). Results are expressed as a percentage of input B cells that migrated to the lower chamber. (B) Fibroblasts expressing CXCR4 (left panel) and B cells expressing either CXCR4 (middle panel) or CXCR5 (right panel) were tested for CXCL12- or CXCL13-triggered actin polymerization using FITC-phalloidin as a probe for intracellular F-actin. Arrows indicate chemokine stimulation. The baseline level of unstimulated cells was set as 100% (dotted line). (C) Cell surface expression of distinct chemokine receptors in control (CTRL#1) and WHIMWT fibroblasts treated with 200 nM of the cognate agonist for 45 min at 37°C. Results indicate the amount of receptors that remains at the cell surface after incubation with agonist. Receptor expression at the surface of cells incubated in medium alone was set as 100%. Following transfection, expression levels of the different chemokine receptors were comparable at the surface of all unstimulated cell types as determined by flow cytometry (data not shown). Results represent the means ± SD of 3–5 independent experiments (A and C) or are representative of 3 independent determinations (B). *P < 0.05; **P < 0.005 compared with healthy subjects.
Figure 1
Figure 1. Analysis of CXCR4 expression in WHIMWT-derived cells.
(A) Membrane expression levels of endogenous CXCR4 in fibroblasts and EBV-B cells from healthy (CTRL), P3, and P4 subjects (upper panels) were determined by flow cytometry using the PE-conjugated 12G5 anti-CXCR4 mAb (white histograms) and compared with control staining measured in the CXCR4-negative CHO and A0.01 cell lines (lower panels). Gray histograms correspond to isotype control Ab. (B) Cell surface expression levels of endogenous CXCR4 in CD4+ T cells from a healthy donor and the Jurkat T cell line (left panels) were compared with those of ectopically expressed CXCR4 following transduction of fibroblasts, EBV-B cells, CHO, and A0.01 cell lines (middle and right panels) with a WT or mutant (1013) CXCR4 cDNA. (C) Lysates of EBV-B cells from CTRL and P4 subjects, A0.01 T cells, and PBLs from a healthy individual, either nontransduced (NT) or transduced with CXCR4WT (WT) or CXCR41013 (1013) cDNA, were incubated with the 12G5 anti-CXCR4 mAb precoated on γ-bind sepharose beads. Immunodetection of precipitated receptors using the SZ1567 anti-CXCR4 Ab revealed bands with molecular weights close to those expected for CXCR4WT and CXCR41013 (~39 and ~36 kDa, respectively). The thin vertical lines on the gel indicate that the lanes were run on the same gel but were noncontiguous. A representative experiment out of 2 (C) or >5 (A and B) independent determinations is shown.
Figure 3
Figure 3. β-arrestin–mediated internalization of CXCR4.
(A and B) CXCR4-transduced fibroblasts from healthy, P3, and P4 subjects were nucleoporated with 5 μg pN1-EGFP (vector), pβ-arrestin1–EGFP (β-arr1), or pβ-arrestin2–EGFP (β-arr2) and treated 15 h after transfection with 200 nM CXCL12 (left panels). Transfection rates >60% were obtained in all cell types as evaluated by flow cytometry. Results are expressed as percentage of CXCR4 expression (100% corresponding to CXCR4 expression at the surface of GFP+-gated cells incubated in medium alone). Probing of protein extracts with an anti–β-arrestin1 or –β-arrestin2 Ab revealed proteins of expected molecular mass (~47 and ~46 kDa for β-arrestin1 and -2, respectively) in each sample (right panels). LDH (~35 kDa) was used as a loading control. (C) Membrane expression levels of CXCR4WT or CXCR41013 upon CXCL12 stimulation in CTRL#1 fibroblasts nucleoporated with 5 μg pN1-EGFP (vector) or pβ-arrestin2–EGFP. After transduction, CXCR4WT and CXCR41013 receptors were expressed at similar levels at the surface of unstimulated cells (data not shown). Results are means ± SD of >3 independent experiments (AC) or are representative out of >3 independent determinations (A and B, right panels). *P < 0.05; **P < 0.005 compared with fibroblasts transfected with vector.
Figure 4
Figure 4. GRK3-mediated internalization and desensitization of CXCR4.
(A) Aforementioned fibroblasts from CTRL#1, P3, and P4 subjects expressing CXCR4 were nucleoporated with 5 μg of either pcDNA1 (vector) or GRK2, -3, -5, or -6 construct and treated 15 h after transfection with 200 nM CXCL12. We always controlled the efficiency of GRK overexpression by IB (Supplemental Figure 2C). (B) CXCL12-promoted internalization of CXCR4WT or CXCR41013 in fibroblasts from CTRL#1 and P3 nucleoporated with 5 μg of either pcDNA1 (vector) or plasmid encoding GRK3 cDNA. (C) Expression of GRK products in fibroblasts from healthy subjects nucleoporated with 5 μg SCR, GRK2, or GRK3 siRNAs. Three days after transfection, GRK mRNA levels were assessed by quantitative PCR (left and middle panels) and normalized to those of IDUA. IB of proteins from whole-cell lysates either with an anti-GRK2/3 mAb (data not shown) or an anti-GRK2 or anti-GRK3 Ab (right panel) revealed proteins of expected molecular mass (~80 kDa). GRK2 or -3 siRNAs had no effect on expression levels of endogenous GRK6 or β-arrestin2 (molecular mass ~65 and ~46 kDa, respectively), as detected using selective Abs (Supplemental Figures 1 and 2). (D) Cell surface expression levels of CXCR4 in GRK2 or -3 siRNA-transfected fibroblasts treated with CXCL12. GRK2 or -3 siRNAs had no effect on expression levels of CXCR4 at the membrane of unstimulated cells (data not shown). (E) CXCR4-transduced fibroblasts from CTRL#1, P3, and P4 individuals were nucleoporated with 5 μg of pcDNA1 (vector) or GRK2 or -3 construct and tested for CXCL12-triggered actin polymerization. Results are means ± SD of 3–6 independent experiments (A and B; C, left and middle panels; and D and E) or are representative of >5 independent determinations (C, right panel). *P < 0.05; #P < 0.005 compared with fibroblasts transfected with vector (A and B) or SCR siRNAs (C and D).
Figure 5
Figure 5. Reduced levels of GRK3 products in P3 leukocytes.
(A and B) The steady-state levels of GRK proteins in leukocytes from P4 (A) and P3 (B) were compared with those obtained in leukocytes from family members and a healthy individual (CTRL#1), respectively. Total protein extracts (20 μg/lane) were analyzed by IB using an anti-GRK2/3, -GRK2, -GRK3, -GRK5/6, or -GRK6 Ab. (C and D) The steady-state levels of GRK transcripts in leukocytes from P3 (C) and P4 (D) were compared by PCR with those obtained in leukocytes from family members and healthy individuals (CTRL#2–5). Semi-quantitative (C, middle panel, and D) and real-time (C, right panel) PCRs were performed using specific primers flanking the full GRK ORFs or within them, respectively. One band corresponding to amplified LDH (~1.3 kb), GRK2 (~2.2 kb), GRK3 (~2.1 kb), GRK5 (~1.8 kb), or GRK6 (~1.8 kb) cDNA products was detected in each sample by semi-quantitative PCR. The thin horizontal lines in the gel indicate that the lanes were run on the same gel but were noncontiguous. Results are from 1 representative experiment of 3 (AD) or are means ± SD of 3 independent determinations performed in triplicate (C, right panel). **P < 0.005 compared with III-1 individual.
Figure 6
Figure 6. Differential steady-state levels of GRK3 products in WHIMWT fibroblasts.
Analyses of GRK protein and mRNA levels in fibroblasts from P3, P4, and 2 independent healthy subjects (CTRL#1 and #2) were performed by IB (A), semi-quantitative (B), and real-time (C) PCRs as described in the legend of Figure 5. Results are from 1 representative experiment of 6 (A and B) or are means ± SD of 3 independent determinations performed in triplicate (C). **P < 0.005 compared with CTRL#1.
Figure 7
Figure 7. Expression and stability of GRK3 mRNAs in WHIMWT fibroblasts.
Fibroblasts from P3, P4, and healthy subjects were incubated with 10 μg/ml ActD (treatment) for the indicated times (A and B) or for 4 h and further cultured for 4 h in the absence of ActD (chase) (C). At the indicated times, total RNA was extracted and semi-quantitative PCRs were performed using specific primers flanking the full LDH or GRK3 ORF. Amplified cDNA products were run on 1% agarose gels, detected by ethidium bromide staining, and quantified by computed-assisted densitometry using the ImageJ 1.34 software (NIH). Results are from 1 representative experiment out of 3 (A and B) or are means ± SD of 3 independent determinations (C) and indicate the amount of mRNAs that remained after incubation with ActD (A and B) or that accumulated in the course of ActD chase (C). Transcript levels in fibroblasts incubated in medium alone were set as 100%. Kinetics of LDH mRNA appearance were comparable in all cell types (data not shown). *P < 0.05.
Figure 8
Figure 8. Consequences of GRK3 expression or knock-down on CXCL12-promoted chemotaxis.
(A) Leukocytes from healthy (CTRL#1) and P3 subjects were nucleoporated with 5 μg of either pcDNA1 (vector) or plasmid encoding GRK3 cDNA and assayed 15 h after transfection for chemotaxis in response to CXCL12. (B) IL-2–expanded leukocytes that contained >95% CD25+ blasted T cells, as evaluated by flow cytometry, from independent healthy individuals were nucleoporated with 5 μg SCR or GRK3 siRNAs. Two days after transfection, leukocytes were tested for their ability to migrate in response to CXCL12 (right panel). Transmigrated cells recovered in the lower chamber were stained with mAbs specific for CD3 and CD4 antigens and counted by flow cytometry. Results, expressed as a percentage of input CD4+-gated T cells that migrated to the lower chamber, are representative of those obtained in CD8+-gated T cells. GRK3 transcript levels were evaluated by quantitative PCR and normalized to those of IDUA (B, left panel). Inhibition or increase of GRK3 expression had no effect on cell surface expression of CXCR4. Results are from 1 representative determination of 2 performed in triplicate (A) or are means ± SD of 3 independent determinations performed in duplicate (B, right panel) or in triplicate (B, left panel). *P < 0.05; **P < 0.005 compared with leukocytes transfected with vector or SCR siRNAs.

Similar articles

Cited by

References

    1. Gorlin R.J., et al. WHIM syndrome, an autosomal dominant disorder: clinical, hematological, and molecular studies. Am. J. Med. Genet. 2000;91:368–376. - PubMed
    1. Diaz G.A. CXCR4 mutations in WHIM syndrome: a misguided immune system? Immunol. Rev. 2005;203:235–243. - PubMed
    1. Hernandez P.A., et al. Mutations in the chemokine receptor gene CXCR4 are associated with WHIM syndrome, a combined immunodeficiency disease. Nat. Genet. 2003;34:70–74. - PubMed
    1. Premont R.T., Gainetdinov R.R. Physiological roles of G protein-coupled receptor kinases and arrestins. Annu. Rev. Physiol. 2007;69:511–534. - PubMed
    1. Busillo J.M., Benovic J.L. Regulation of CXCR4 signaling. Biochim. Biophys. Acta. 2007;1768:952–963. - PMC - PubMed

Publication types

MeSH terms