

TRPC3 is the erythropoietin-regulated calcium channel in human erythroid cells
- PMID: 18276585
- PMCID: PMC2447643
- DOI: 10.1074/jbc.M710231200
TRPC3 is the erythropoietin-regulated calcium channel in human erythroid cells
Abstract
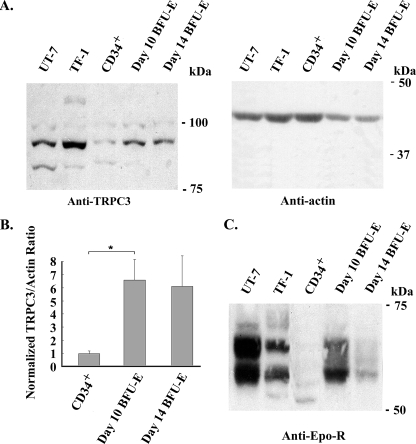
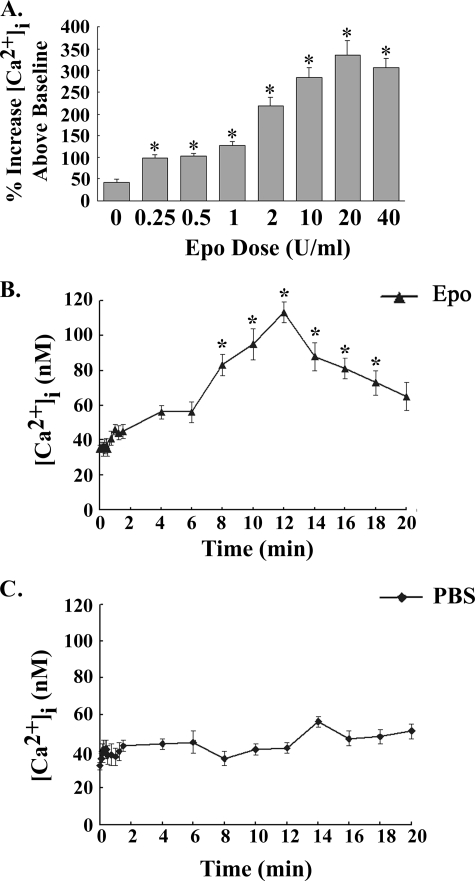
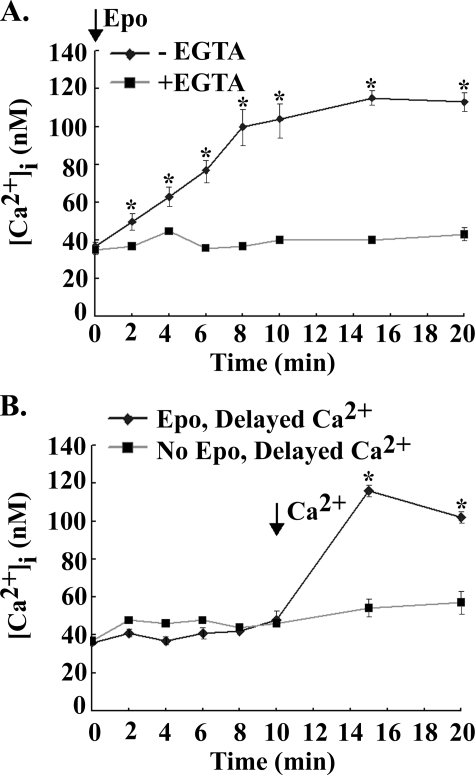
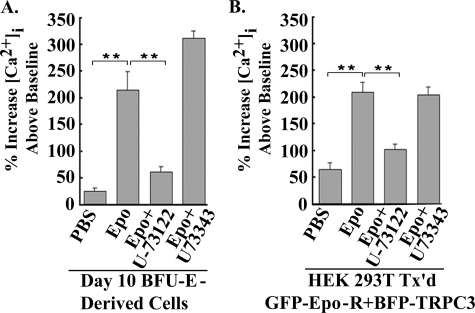
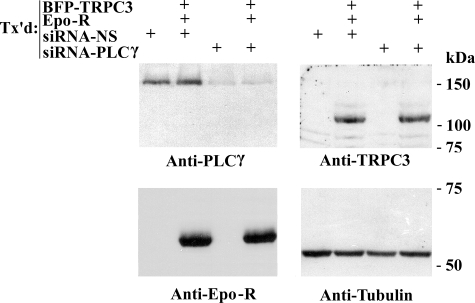
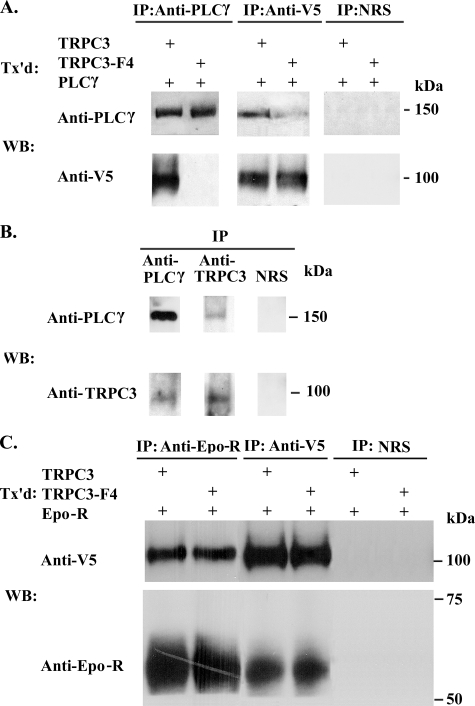
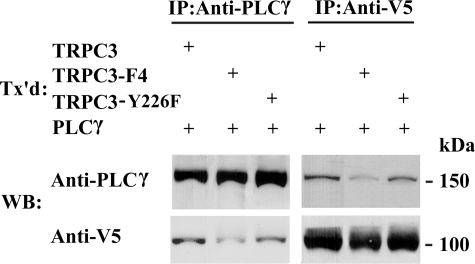
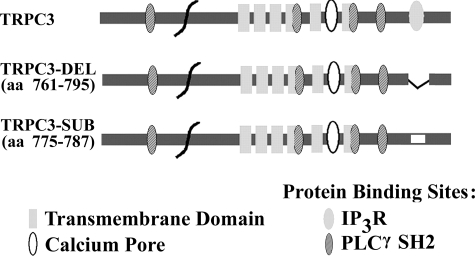
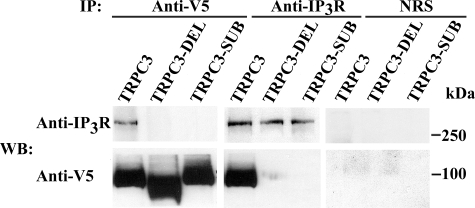
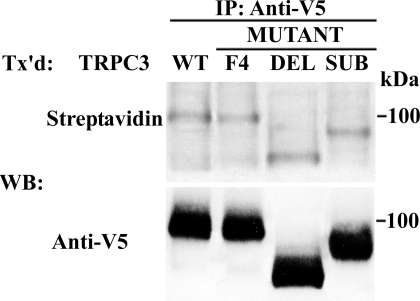
Erythropoietin (Epo) stimulates a significant increase in the intracellular calcium concentration ([Ca(2+)](i)) through activation of the murine transient receptor potential channel TRPC2, but TRPC2 is a pseudogene in humans. TRPC3 expression increases on normal human erythroid progenitors during differentiation. Here, we determined that erythropoietin regulates calcium influx through TRPC3. Epo stimulation of HEK 293T cells transfected with Epo receptor and TRPC3 resulted in a dose-dependent increase in [Ca(2+)](i), which required extracellular calcium influx. Treatment with the phospholipase C (PLC) inhibitor U-73122 or down-regulation of PLCgamma1 by RNA interference inhibited the Epo-stimulated increase in [Ca(2+)](i) in TRPC3-transfected HEK 293T cells and in primary human erythroid precursors, demonstrating a requirement for PLC. TRPC3 associated with PLCgamma, and substitution of predicted PLCgamma Src homology 2 binding sites (Y226F, Y555F, Y648F, and Y674F) on TRPC3 reduced the interaction of TRPC3 with PLCgamma and inhibited the rise in [Ca(2+)](i). Substitution of Tyr(226) alone with phenylalanine significantly reduced the Epo-stimulated increase in [Ca(2+)](i) but not the association of PLCgamma with TRPC3. PLC activation results in production of inositol 1,4,5-trisphosphate (IP(3)). To determine whether IP(3) is involved in Epo activation of TRPC3, TRPC3 mutants were prepared with substitution or deletion of COOH-terminal IP(3) receptor (IP(3)R) binding domains. In cells expressing TRPC3 with mutant IP(3)R binding sites and Epo receptor, interaction of IP(3)R with TRPC3 was abolished, and Epo-modulated increase in [Ca(2+)](i) was reduced. Our data demonstrate that Epo modulates TRPC3 activation through a PLCgamma-mediated process that requires interaction of PLCgamma and IP(3)R with TRPC3. They also show that TRPC3 Tyr(226) is critical in Epo-dependent activation of TRPC3. These data demonstrate a redundancy of TRPC channel activation mechanisms by widely different agonists.
Figures
Similar articles
-
Erythropoietin-modulated calcium influx through TRPC2 is mediated by phospholipase Cgamma and IP3R.Am J Physiol Cell Physiol. 2004 Dec;287(6):C1667-78. doi: 10.1152/ajpcell.00265.2004. Epub 2004 Aug 25. Am J Physiol Cell Physiol. 2004. PMID: 15329338
-
TRPC3 activation by erythropoietin is modulated by TRPC6.J Biol Chem. 2009 Feb 13;284(7):4567-81. doi: 10.1074/jbc.M804734200. Epub 2008 Dec 13. J Biol Chem. 2009. PMID: 19074769 Free PMC article.
-
The transient receptor potential (TRP) channel TRPC3 TRP domain and AMP-activated protein kinase binding site are required for TRPC3 activation by erythropoietin.J Biol Chem. 2011 Sep 2;286(35):30636-30646. doi: 10.1074/jbc.M111.238360. Epub 2011 Jul 14. J Biol Chem. 2011. PMID: 21757714 Free PMC article.
-
Protein-protein interaction and functionTRPC channels.Pflugers Arch. 2005 Oct;451(1):116-24. doi: 10.1007/s00424-005-1442-2. Epub 2005 Jul 26. Pflugers Arch. 2005. PMID: 16044307 Review.
-
Signalling mechanisms for TRPC3 channels.Novartis Found Symp. 2004;258:123-33; discussion 133-9, 155-9, 263-6. Novartis Found Symp. 2004. PMID: 15104179 Review.
Cited by
-
TRPC channels and their implication in neurological diseases.CNS Neurol Disord Drug Targets. 2010 Mar;9(1):94-104. doi: 10.2174/187152710790966650. CNS Neurol Disord Drug Targets. 2010. PMID: 20201820 Free PMC article. Review.
-
Molecular basis for the sensitivity of TRP channels to polyunsaturated fatty acids.Naunyn Schmiedebergs Arch Pharmacol. 2018 Aug;391(8):833-846. doi: 10.1007/s00210-018-1507-3. Epub 2018 May 8. Naunyn Schmiedebergs Arch Pharmacol. 2018. PMID: 29736621 Free PMC article.
-
Identification and functional characterization of ion channels in CD34(+) hematopoietic stem cells from human peripheral blood.Mol Cells. 2011 Aug;32(2):181-8. doi: 10.1007/s10059-011-0068-9. Epub 2011 Jun 1. Mol Cells. 2011. PMID: 21638203 Free PMC article.
-
DOT1L Methyltransferase Regulates Calcium Influx in Erythroid Progenitor Cells in Response to Erythropoietin.Int J Mol Sci. 2022 May 5;23(9):5137. doi: 10.3390/ijms23095137. Int J Mol Sci. 2022. PMID: 35563527 Free PMC article.
-
Calcium homeostasis in red blood cells of dialysis patients in dependence of erythropoietin treatment.Front Physiol. 2014 Jan 27;5:16. doi: 10.3389/fphys.2014.00016. eCollection 2014. Front Physiol. 2014. PMID: 24478727 Free PMC article. No abstract available.
References
-
- Richmond, T. D., Chohan, M., and Barber, D. L. (2005) Trends Cell Biol. 15 146–155 - PubMed
-
- Cheung, J. Y., and Miller, B. A. (2001) Nephron 87 215–222 - PubMed
-
- Kaushansky, K. (2006) N. Engl. J. Med. 354 2034–2045 - PubMed
-
- Cheung, J. Y., Zhang, X. Q., Bokvist, K., Tillotson, D. L., and Miller, B. A. (1997) Blood 89 92–100 - PubMed
Publication types
MeSH terms
Substances
Grants and funding
LinkOut - more resources
Full Text Sources
Research Materials
Miscellaneous
