. 2008 Apr 11;283(15):9787-96.
doi: 10.1074/jbc.M708839200. Epub 2008 Feb 13.

Discovery of TBC1D1 as an insulin-, AICAR-, and contraction-stimulated signaling nexus in mouse skeletal muscle

Affiliations

Discovery of TBC1D1 as an insulin-, AICAR-, and contraction-stimulated signaling nexus in mouse skeletal muscle

Eric B Taylor et al. J Biol Chem. .

Abstract

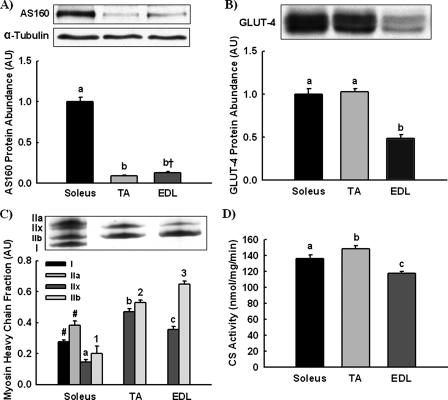
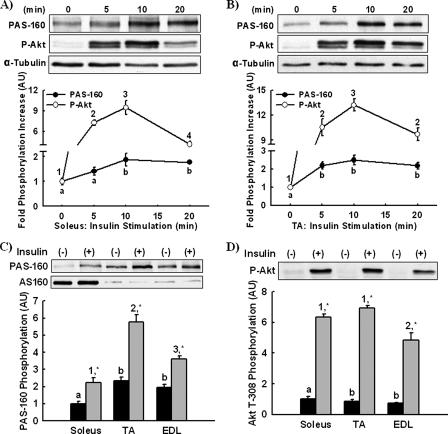
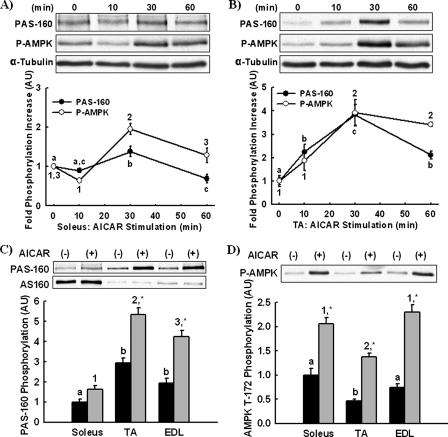
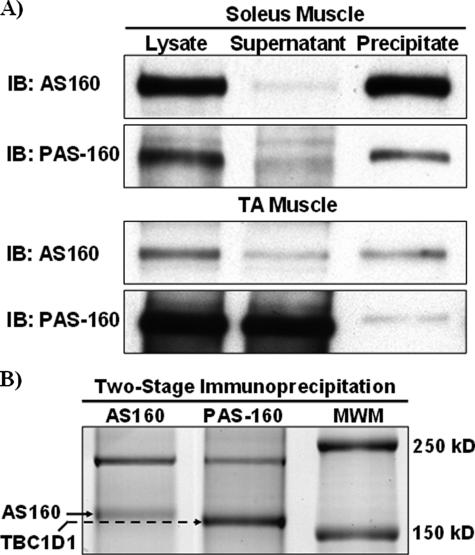
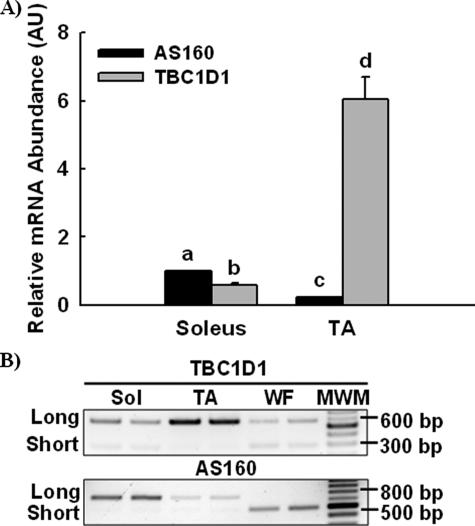
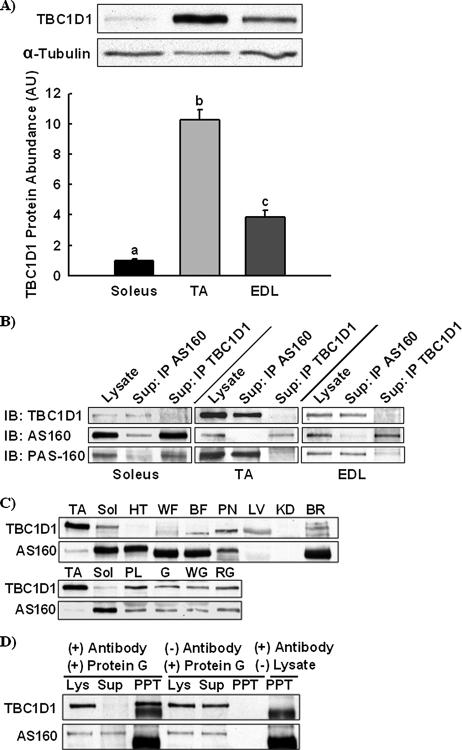
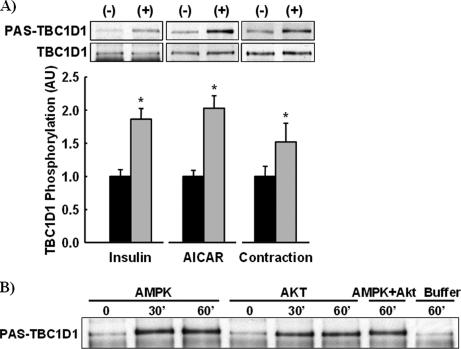
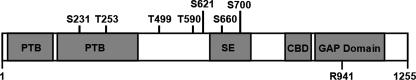
The Akt substrate of 160 kDa (AS160) is phosphorylated on Akt substrate (PAS) motifs in response to insulin and contraction in skeletal muscle, regulating glucose uptake. Here we discovered a dissociation between AS160 protein expression and apparent AS160 PAS phosphorylation among soleus, tibialis anterior, and extensor digitorum longus muscles. Immunodepletion of AS160 in tibialis anterior muscle lysates resulted in minimal depletion of the PAS band at 160 kDa, suggesting the presence of an additional PAS immunoreactive protein. By immunoprecipitation and mass spectrometry, we identified this protein as the AS160 paralog TBC1D1, an obesity candidate gene regulating GLUT4 translocation in adipocytes. TBC1D1 expression was severalfold higher in skeletal muscles compared with all other tissues and was the dominant protein detected by the anti-PAS antibody at 160 kDa in tibialis anterior and extensor digitorum longus but not soleus muscles. In vivo stimulation by insulin, contraction, and the AMP-activated protein kinase (AMPK) activator AICAR increased TBC1D1 PAS phosphorylation. Using mass spectrometry on TBC1D1 from mouse skeletal muscle, we identified several novel phosphorylation sites on TBC1D1 and found the majority were consensus or near consensus sites for AMPK. Semiquantitative analysis of spectra suggested that AICAR caused greater overall phosphorylation of TBC1D1 sites compared with insulin. Purified Akt and AMPK phosphorylated TBC1D1 in vitro, and AMPK, but not Akt, reduced TBC1D1 electrophoretic mobility. TBC1D1 is a major PAS immunoreactive protein in skeletal muscle that is phosphorylated in vivo by insulin, AICAR, and contraction. Both Akt and AMPK phosphorylate TBC1D1, but AMPK may be the more robust regulator.


Figures

FIGURE 1.
FIGURE 1.
AS160 protein abundance is greatest in soleus muscle. Relative AS160 protein (A) and GLUT4 protein abundances (B) were compared in soleus, TA, and EDL muscle by immunoblotting. α-Tubulin was utilized as a loading control for both AS160 and GLUT4 but is only shown for AS160 because quantitated images for AS160 and GLUT4 were from the same gels. C, myosin heavy chain fractions were determined by electrophoretic separation and silver staining. D, citrate synthase (CS) activity was measured by spectrophotometric assay. The data are expressed as means ± S.E. (n = 6-8). a-c, 1-3, groups within each panel not sharing a common letter are statistically different at p < 0.05; †, p = 0.052. Groups annotated by letters cannot be compared with groups annotated by numbers. #, types I and IIa myosin heavy chain were only detected in soleus muscle and excluded from the statistical analysis.
FIGURE 2.
FIGURE 2.
Insulin-stimulated PAS-160 phosphorylation is greatest in TA muscle. The time courses of insulin-stimulated Akt substrate phosphorylation at a molecular weight of 160 (PAS-160) and Akt Thr-308 phosphorylation (P-Akt) in vivo were assessed by injecting mice with insulin intraperitoneally for 0 (control), 5, 10, or 20 min. PAS-160 and P-Akt were measured in soleus (A) and tibialis anterior muscle lysates (B) by immunoblotting. α-Tubulin was utilized as a loading control. Maximal PAS-160 (C) and P-Akt phosphorylation (D) between soleus, TA, and EDL muscles were compared by immunoblotting lysates from the 10-min time points. A paired immunoblot for AS160 is included in panel C. The data are expressed as the means ± S.E. (n = 6-8). a and b, 1-4, groups within each panel not marked by the same letter or number are statistically different. Groups annotated by letters cannot be compared with groups annotated by numbers. *, Insulin stimulation for a given muscle had a statistically significant effect on phosphorylation compared with basal, p < 0.05.
FIGURE 3.
FIGURE 3.
AICAR-stimulated PAS-160 phosphorylation is greatest in TA muscle. The time courses of AICAR-stimulated Akt substrate phosphorylation at a molecular weight of 160 (PAS-160) and AMPK Thr-172 phosphorylation (P-AMPK) in vivo were determined by injecting mice with AICAR subcutaneously for 0 (control), 10, 30, or 60 min. PAS-160 and P-AMPK were measured in soleus (A) and tibialis anterior muscle (B) lysates by immunoblotting. α-Tubulin was utilized as a loading control. Maximal PAS-160 (C) and P-AMPK (D) phosphorylation between soleus, TA, and EDL muscle was compared by immunoblotting lysates from the 30-min time points. A paired immunoblot for AS160 is included in panel C. The data are expressed as the means ± S.E. (n = 3-8). a-c, 1-3, groups within each panel not marked by the same letter or number are statistically different. Groups annotated by letters cannot be compared with groups annotated by numbers. *, AICAR stimulation for a given muscle had a statistically significant effect on phosphorylation compared with basal, p < 0.05.
FIGURE 4.
FIGURE 4.
Identification of TBC1D1 as PAS-160 in TA muscle. A, to determine whether AS160 was the phospho-Akt-substrate detected at a molecular weight of 160 (PAS-160) in soleus and tibialis anterior muscle, AS160 was immunoprecipitated from insulin-stimulated soleus and tibialis anterior muscle lysates. Lysates, supernatants, and immunoprecipitated AS160 were immunoblotted (IB) for both AS160 and PAS-160. Gels for AS160 and PAS-160 immunoblots were loaded identically with volume equivalents of lysates and supernatants and a supra-proportional amount of AS160 immunoprecipitate to compensate for inefficient elution. AS160 and PAS-160 immunodepletion and immunoprecipitation patterns matched in soleus but not tibialis anterior muscle. B, to determine the identity of PAS-160 in tibialis anterior muscle, lysates were first immunodepleted of AS160; then the PAS antibody was used to immunoprecipitate the remaining PAS-160. AS160 and PAS-160 immunoprecipitates were subjected to SDS-PAGE and stained with Coomassie Blue. The AS160 and PAS-160 bands were excised from the gel and identified by mass spectrometry. The identity of AS160 was confirmed, and PAS-160 was identified as TBC1D1.
FIGURE 5.
FIGURE 5.
TBC1D1 and AS160 mRNA expression and relative distribution of splice variants. A, relative TBC1D1 and AS160 mRNA abundances were compared by isolating RNA from TA and soleus muscle, reverse transcribing RNA to cDNA, and then amplifying cDNA by real-time PCR. The data are expressed as the means ± S.E. (n = 8). a-d, groups within each panel not sharing a common letter or number are statistically different, p < 0.05. B, relative expression of TBC1D1 and AS160 splice variants within soleus muscle, tibialis anterior muscle, and white fat were compared by isolating RNA, reverse transcribing RNA to cDNA, amplifying TBC1D1 and AS160 cDNA by PCR with splice exon-flanking primers, separating amplicons by agarose gel electrophoresis, and imaging with ethidium bromide staining under ultraviolet light. Replicates produced similar results.
FIGURE 6.
FIGURE 6.
TBC1D1 is the major PAS-160 in skeletal muscle. A, relative TBC1D1 protein abundance in soleus, TA, and EDL muscle was compared by immunoblotting. α-Tubulin was utilized as a loading control. The data are expressed as means ± S.E. (n = 8). a-c, groups within each panel not sharing a common letter or number are statistically different, p < 0.05. B, AS160 and TBC1D1 were immunoprecipitated (IP) from soleus, TA, and EDL muscle lysates. Pre-depletion lysates and depleted supernatants were immunoblotted (IB) for TBC1D1, AS160, and phospho-Akt substrate at a molecular weight of 160 (PAS-160). C, TBC1D1 and AS160 protein expression in TA, soleus muscle (sol), heart (HT), white adipose tissue (WA), brown adipose tissue (BA), pancreas (PN), liver (LV), kidney (KD), brain (BR), plantaris muscle (P), whole gastrocnemius muscle (G), white gastrocnemius muscle (WG), and red gastrocnemius muscle (RG) were compared by immunoblotting. Replicates produced similar results. D, to confirm that the anti-TBC1D1 antibody did not cross-react with AS160, TBC1D1 was immunoprecipitated from a tibialis anterior muscle lysate, and the pre-depletion lysate, supernatant, and immunoprecipitate (PPT) were immunoblotted for TBC1D1 and AS160. Gels for TBC1D1 and AS160 immunoblots were loaded identically. Immunoprecipitations without antibody or lysate were included as additional controls and demonstrated that the immunodepletion and immunoprecipitation of TBC1D1 were dependent upon the anti-TBC1D1 antibody but that the anti-TBC1D1 antibody alone did not generate the TBC1D1 signal detected in the immunoprecipitate lane.
FIGURE 7.
FIGURE 7.
Insulin, AICAR, and contraction regulate TBC1D1 phosphorylation in skeletal muscle. A, TBC1D1 was immunoprecipitated from insulin-, AICAR-, and contraction-stimulated tibialis anterior muscle lysates and immunoblotted for both TBC1D1 and PAS phosphorylation. TBC1D1 phosphorylation was calculated by normalizing PAS-phosphorylated TBC1D1 to total TBC1D1. The data are expressed as the means ± S.E. (n = 6-8). *, stimulation caused a statistically significant increase in TBC1D1 phosphorylation compared with controls, p < 0.05. B, immunoprecipitated TBC1D1 was phosphorylated in vitro by AMPK and Akt for 0, 30, or 60 min, by AMPK and Akt combined for 60 min, and buffer alone for 60 min. Replicates produced similar results.
FIGURE 8.
FIGURE 8.
Diagram of TBC1D1 structure. TBC1D1 harbors two phosphotyrosine binding domains (PTB), a splice-exon (SE), a calmodulin-binding domain (CBD), seven identified phosphorylation sites, and a rab-GTPase activating domain (GAP domain). Arg-941 is the arginine residue necessary for catalytic activity.

References

    1. Richter, E. A., Nielsen, J. N., Jorgensen, S. B., Frosig, C., Birk, J. B., and Wojtaszewski, J. F. (2004) Proc. Nutr. Soc. 63 211-216 - PubMed
    1. Jessen, N., and Goodyear, L. J. (2005) J. Appl. Physiol. 99 330-337 - PubMed
    1. Kennedy, J. W., Hirshman, M. F., Gervino, E. V., Ocel, J. V., Forse, R. A., Hoenig, S. J., Aronson, D., Goodyear, L. J., and Horton, E. S. (1999) Diabetes 48 1192-1197 - PubMed
    1. Kramer, H. F., Witczak, C. A., Taylor, E. B., Fujii, N., Hirshman, M. F., and Goodyear, L. J. (2006) J. Biol. Chem. 281 31478-31485 - PubMed
    1. Sano, H., Kane, S., Sano, E., Miinea, C. P., Asara, J. M., Lane, W. S., Garner, C. W., and Lienhard, G. E. (2003) J. Biol. Chem. 278 14599-14602 - PubMed

Publication types

MeSH terms