. 2008 Jun 1;17(11):1540-55.
doi: 10.1093/hmg/ddn042. Epub 2008 Feb 14.

Autophagy induced by Alexander disease-mutant GFAP accumulation is regulated by p38/MAPK and mTOR signaling pathways

Affiliations

Autophagy induced by Alexander disease-mutant GFAP accumulation is regulated by p38/MAPK and mTOR signaling pathways

Guomei Tang et al. Hum Mol Genet. .

Abstract

Glial fibrillary acidic protein (GFAP) is the principle intermediate filament (IF) protein in astrocytes. Mutations in the GFAP gene lead to Alexander disease (AxD), a rare, fatal neurological disorder characterized by the presence of abnormal astrocytes that contain GFAP protein aggregates, termed Rosenthal fibers (RFs), and the loss of myelin. All GFAP mutations cause the same histopathological defect, i.e. RFs, though little is known how the mutations affect protein accumulation as well as astrocyte function. In this study, we found that GFAP accumulation induces macroautophagy, a key clearance mechanism for prevention of aggregated proteins. This autophagic response is negatively regulated by mammalian target of rapamycin (mTOR). The activation of p38 MAPK by GFAP accumulation is in part responsible for the down-regulation of phosphorylated-mTOR and the subsequent activation of autophagy. Our study suggests that AxD mutant GFAP accumulation stimulates autophagy, in a manner regulated by p38 MAPK and mTOR signaling pathways. Autophagy, in turn, serves as a mechanism to reduce GFAP levels.


Figures
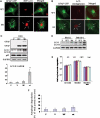
Figure 1.
Figure 1.
Evidence for autophagy in U251 astrocytoma cells stably expressing R239C AxD mutant GFAP. (A) Co-localization of RFP-LC3 with cytoplasmic GFAP aggregates, indicated by arrows. U251 cells stably expressing EGFP-C1 vector, wt or mt GFAPs were transiently transfected with RFP-LC3. Forty-eight hours after transfection, cells were treated with cytoskeletal buffer and fixed with 4% PFA and then examined for GFAP (green) and LC3 (red) fluorescence. (B) Overlap of endogenous LC3 and GFAP aggregates in GFAP expressing U251 cells. U251 cells were treated with cytoskeletal buffer and fixed with 4% PFA, then were immunostained for LC3. Merged images on right show LC3 in red, GFAP-GFP in green and the overlap in yellow, aggregates were indicated by arrows. (C) Immunoblotting analysis of LC3 in U251 cells stably expressing GFAPs (upper panel). Each gel labeled with V, vector-control; WT, WT GFAP; Mt, mt GFAP. Lower panel: quantitative immunoblot analysis of LC3 activation, represented by LC3-II to GAPDH ratio, under normal growth conditions in U251 astrocytoma cells stably transfected with wild-type and mutant GFAP. ** P < 0.001. (D) Increased autophagic flux in mt GFAP expressing U251cells, represented by the differences between LC3-II level between BfaA1 treated and non-treated cells. (E) Long-lived bulk protein degradation. Compared to U251 cells under normal growth conditions, no significant differences were observed in cells overexpressing wt and mt GFAPs, and cells upon amino acid- and serum-deprivation in the presence or absence of 3-MA macroautophagy inhibitor. n = 6 wells, mean ± SEM two-tailed ANOVA. (F) The proportion of total protein turnover due to autophagy in different cell lines.
Figure 2.
Figure 2.
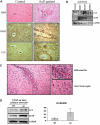
Signs of autophagy in brain tissue of AxD patients and R236H/+ mt GFAP knock-in mice. (A) Immunohistochemistry of brain tissue of an AxD case (R239H) and a control subject, using antibodies against GFAP and LC3. Photograph from a patient showed extensive brightly eosinophilic staining red Rosenthal fibers (arrows) in a perivascular distribution (H&E, 40×). Compared to healthy control’s white matter, GFAP immunostaining disclosed many RFs in the AxD white matter, especially in perivascular areas. Correlated with the GFAP staining, the signal for LC3 staining was increased in areas enriched in RFs. *, blood vessel, ▴, RFs. (B) Immunoblotting analysis of LC3 in AxD patients with different GFAP mutations. (C) H&E staining showed RFs in the rostral migratory stream of a GFAP knock-in mouse. Note that RFs are never seen in wild-type mice (17). (D) Immunoblotting analysis of LC3 in astrocytes isolated from the whole brains of wild-type or R239H/+ GFAP mutant mice. Note that only a small fraction of astrocytes in GFAP mt mouse brain contained RFs. In spite of this fact, we still detected a slight increase of protein level of LC3-II. The protein level of LC3-I was also increased in astrocytes from GFAP mutant mice. →, GFAP aggregates.
Figure 3.
Figure 3.
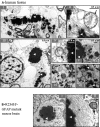
Transmission electron microscopy of AxD white matter, R239H/- GFAP mutant mouse brain and GFAP aggregate-containing U251 cells. (A) Typical autophagic vacuoles (AVs) in RF-containing astrocytes in L359V AxD brain. A-I, abnormal astrocyte process containing RFs. A-II, a typical autophagosome, with double-limiting membranes, adjacent to the skein of GFAP intermediate filaments, as shown in boxed area in A-I. A-III, another instance of affected astrocytes with RFs and multiple vesicular vacuoles. A-IV, A-V: autophagosomes close to RFs. A-VI, A-VII, vacuoles with single-limiting membranes. (B) A representative autophagosome in a RF-containing astrocyte in a R236H/- GFAP mutant mouse brain (B-II), as shown in boxed area in B-I. Note vesicular structures are located in the vicinity of RFs and the skeins of GFAP filaments (B-I). (C) GFAP filaments and AVs in GFAP aggregate-containing U251 cells. Note that AVs were frequently seen in mt cells (C-IV), and occasionally in wt GFAP expressing cells (C-III). C-V, VI,VII,VIII, XI and X, representative AVs in mt GFAP expressing U251 cells. * filaments; →, autophagosomes; ▴, Rosenthal fibers or GFAP aggregates; ♂, vacuoles with single-limiting membranes, reflecting autolysosomes; #, multilamellar bodies. Scale bar: 0.5 µm, Magnification: 25 000×.
Figure 3.
Figure 3.
Transmission electron microscopy of AxD white matter, R239H/- GFAP mutant mouse brain and GFAP aggregate-containing U251 cells. (A) Typical autophagic vacuoles (AVs) in RF-containing astrocytes in L359V AxD brain. A-I, abnormal astrocyte process containing RFs. A-II, a typical autophagosome, with double-limiting membranes, adjacent to the skein of GFAP intermediate filaments, as shown in boxed area in A-I. A-III, another instance of affected astrocytes with RFs and multiple vesicular vacuoles. A-IV, A-V: autophagosomes close to RFs. A-VI, A-VII, vacuoles with single-limiting membranes. (B) A representative autophagosome in a RF-containing astrocyte in a R236H/- GFAP mutant mouse brain (B-II), as shown in boxed area in B-I. Note vesicular structures are located in the vicinity of RFs and the skeins of GFAP filaments (B-I). (C) GFAP filaments and AVs in GFAP aggregate-containing U251 cells. Note that AVs were frequently seen in mt cells (C-IV), and occasionally in wt GFAP expressing cells (C-III). C-V, VI,VII,VIII, XI and X, representative AVs in mt GFAP expressing U251 cells. * filaments; →, autophagosomes; ▴, Rosenthal fibers or GFAP aggregates; ♂, vacuoles with single-limiting membranes, reflecting autolysosomes; #, multilamellar bodies. Scale bar: 0.5 µm, Magnification: 25 000×.
Figure 4.
Figure 4.
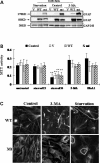
Effects of 3-MA and starvation on GFAP accumulation. (A) U251 cells stably expressing vector control (V), wt GFAP(WT) and mt GFAP(mt) were incubated with medium with or without 3-MA or starved for 12 h. Total cell lysates were subjected to SDS–PAGE and western-blotting analysis with antibodies against GFAP and GAPDH. (B) U251 cells were subject to 3-MA and BfaA1 for 24 h, to starvation for 12 (starved12) or 24 (starved24) hours. Cell viability was represented by methylthiazoletetrazolium (MTT) activity. Each result represents a mean ± SD of MTT activity from three independent experiments carried out in triplicate. * By student's t-test, and compared with untreated controls, P < 0.05. Control: untransfected U251 cells. (C) Morphological changes of GFAP expressing U251 cells. Cells were incubated with 3-MA or starved, then fixed and processed for GFP fluorescence. More GFAP filamentous bundles occurred in wt and dot aggregates in mt after 3-MA treatment. Starved cells are more spread out, with fewer GFAP aggregates.
Figure 5.
Figure 5.
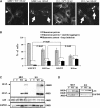
Autophagy deficiency leads to more GFAP aggregation. (A) Representative GFAP filaments or inclusions in wild-type and Atg5−/− MEFs. →, filamentous pattern+small dot aggregates, filamentous pattern, ▸ filamentous pattern+large inclusions. WT: wt GFAP; mt: mt GFAP. (B) Percentage of cells with different phenotypes in wild-type and Atg5−/− MEFs. Results are average ± SD from three independent experiments, with at least 400 transfected cells counted in each. Compared with wt and by student's t-test, P < 0.05. (C and D) Immunoblot analysis of GFAP (C) and LC3 (D). In wt or mt GFAP expressing Atg5−/− MEFs. Wild type and Atg5−/− MEFs were transfected with pcDNA3/GFAP constructs. An EGFP-C1 vector was cotransfected to normalize the transfection efficiency, as indicated by GFP level. Forty-eight hours later, total cell lysates were prepared and subjected to western-blotting analysis for GFAP (C) and LC3 (D).
Figure 6.
Figure 6.
Implication of mTOR in autophagic mt GFAP degradation. (A) Reduced phosphorylation of mTOR, Akt and p70S6K in mt GFAP overexpressing U251 cells. Protein extracts from vector control(V), wt (WT) and mt (mt) GFAP expressing U251 cells were subjected to western-blotting analysis with antibodies against phosphor-mTOR (p-mTOR), total mTOR (T-mTOR), phospho-p70S6K (p-S6K), total p70S6K (T-S6K), phosphor-Akt (p-Akt) and total Akt (T-Akt). (B) Quantitative analysis of p-mTOR, p-Akt and p-S6K in U251 cells expressing EGFP-C1 vector (V), wt (WT) and mt GFAPs (mt). In comparing cells transfected with vector only as control (100%), protein levels of p-mTOR, p-Akt and p-S6K were reduced markedly in mt GFAP expressing cells. (C) Inhibiting mTOR stabilized GFAP protein. U251 cells stably expressing GFAPs were exposed to fresh medium with Rapamycin (Upper), with those starved cells as positive control. (D) Effects of mTOR SiRNA on m-TOR level and GFAP protein level. EGFP-C1 vector, wt and mt GFAP expressing U251 cells were transfected with control SiRNA or mTOR SiRNA. Proteins were extracted at 48 h post-transfection and subjected to immunoblotting analysis. (E) Quantitation of levels of T-mTOR and p-mTOR in vector control cells transfected with control SiRNA and mTOR SiRNA. Control SiRNA has no effects on the level of p-mTOR, while mTOR SiRNA decreased the p-mTOR. (F) Effects of mTOR SiRNA on GFAP levels. Protein levels of wt or mt GFAP in U251 cells transfected with control SiRNA and mTOR SiRNA were quantified and plotted. (G) Effects of Av-Akt on GFAP accumulation. U251 cells stably expressing GFAP (wt or mt) were transfected with PCMV-AvAkt constructs. Forty-eight hours later, protein was harvested and subjected to immunoblotting analysis (upper). The optical density of p-mTOR protein bands was quantified and plotted to analyze the effects of Akt constructs on mTOR phosphorylation (lower). Av-Akt, constitutively active form of Akt; Myr AvAkt: a myristylated constitutively active form of Akt; E40K AvAKt, constitutively active Akt E40K mutant.
Figure 7.
Figure 7.
p38 negatively regulates mTOR-dependent autophagic GFAP degradation. (A and B) Effects of p38/MAPK on GFAP accumulation and aggregation. U251 cells stably expressing wt or mt GFAP were exposed to fresh medium or medium with SB203580 (5 uM), SP600125 (10 uM) and anisomysin (200 nm) overnight. (A) Percentage of cells with aggregates upon exposure to different chemicals. Results are average ± SD from three independent experiments, with at least 400 transfected cells counted in each. A larger percentage of mutant GFAP expressing cells, compared to wt expressing cells, contained aggregates under all treatment conditions. Different treatments were then compared within the mt GFAP expressing group, using DMSO as control. ** Compared to DMSO control, by student's t-test, P < 0.001. (B) Western-blotting analysis of GFAP protein levels. Note that activating p38 decreased GFAP levels while inhibiting p38 increased GFAP levels. (C) Immunoblots of phospho-p38 (p-p38) in U251 astrocytoma stably expressing GFAP (left) and in white matter from AxD patients (right panel). (D) Western-blotting analysis of the effects of AvMKK3 and dnMKK3 on the mTOR mediated autophagy induced by mt GFAP accumulation. Activation of p38 by AvMKK3 down-regulated, while inhibition of p38 via dnMKK3 up-regulated, levels of p-mTOR. The LC3-II level showed the opposite tendency relative to that of p-mTOR. (E) Quantitation of levels of p-mTOR, p-P70S6K and LC3-II/GAPDH in U251, U251/wt and U251/mt cells expressing AvMKK3, dn MKK3 and a pRSV vector, respectively. Compared to pRSV vector control cells, *P < 0.05, **P < 0.001, by two-tailed ANOVA.
Figure 8.
Figure 8.
p38 regulates autophagy in astrocytes in an mTOR dependent manner. U251 cells stably expressing EGFP-C1 vector control (V), wt GFAP (wt) and mt GFAP (mt) were transiently transfected with mTOR siRNA, p38 SiRNA or both. Forty-eight hours later, protein was extracted and subjected to immunoblotting analysis. The expression of mTOR siRNA had no effects on levels of p-p38, but increased LC3 levels in all three lines. Expressing the p38 siRNA increased p-mTOR levels in all three lines and blocked the conversion of LC3-I to LC3-II. Co-expressing both p38 siRNA and mTOR SiRNA blocked the inhibitory effect of the p38 siRNA on autophagy.
Figure 9.
Figure 9.
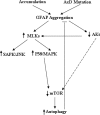
A proposed model of activation of autophagy by GFAP accumulation.

Similar articles

Cited by

References

    1. Goldman J.E., Corbin E. Isolation of a major protein component of Rosenthal fibers. Am. J. Pathol. 1988;130:569–578. - PMC - PubMed
    1. Head M.W., Corbin E., Goldman J.E. Overexpression and abnormal modification of the stress proteins alpha B-crystallin and HSP27 in Alexander disease. Am. J. Pathol. 1993;143:1743–1753. - PMC - PubMed
    1. Brenner M., Johnson A.B., Boespflug-Tanguy O., Rodriguez D., Goldman J.E., Messing A. Mutations in GFAP, encoding glial fibrillary acidic protein, are associated with Alexander disease. Nat. Genet. 2001;27:117–120. - PubMed
    1. Johnson A.B. Alexander disease: a leukodystrophy caused by a mutation in GFAP. Neurochem. Res. 2004;29:961–964. - PubMed
    1. Li R., Messing A., Goldman J.E., Brenner M. GFAP mutations in Alexander disease. Int. J. Dev. Neurosci. 2002;20:259–268. - PubMed

Publication types

MeSH terms