. 2008 Apr 15;586(8):2061-75.
doi: 10.1113/jphysiol.2007.147298. Epub 2008 Feb 14.

Efficient Ca2+ buffering in fast-spiking basket cells of rat hippocampus

Affiliations

Efficient Ca2+ buffering in fast-spiking basket cells of rat hippocampus

Yexica Aponte et al. J Physiol. .

Abstract

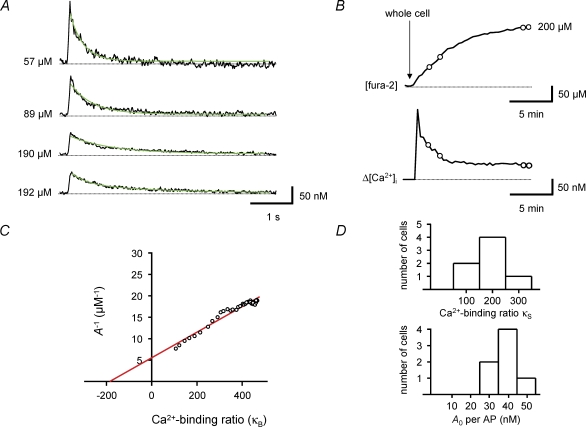
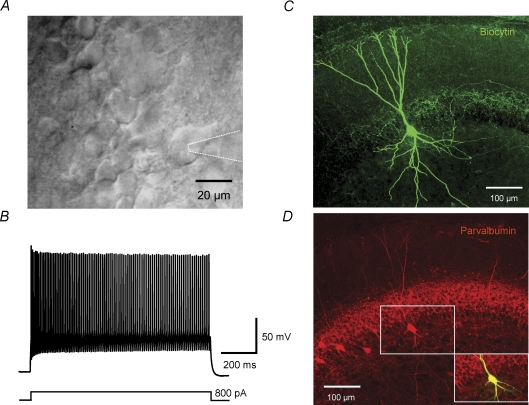
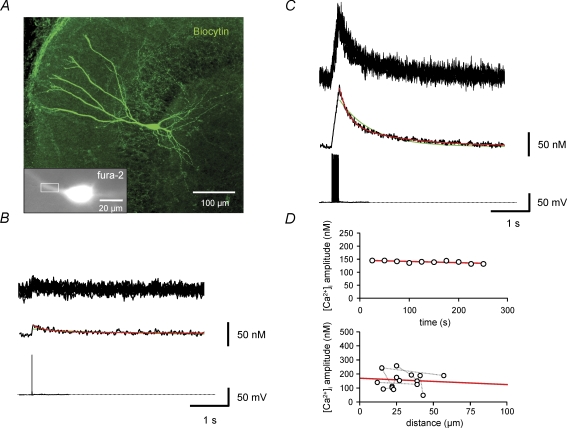
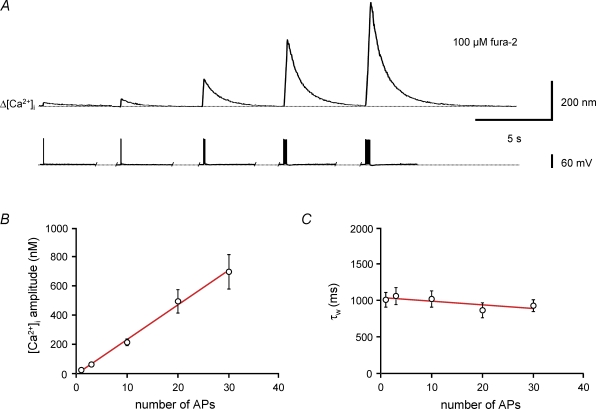
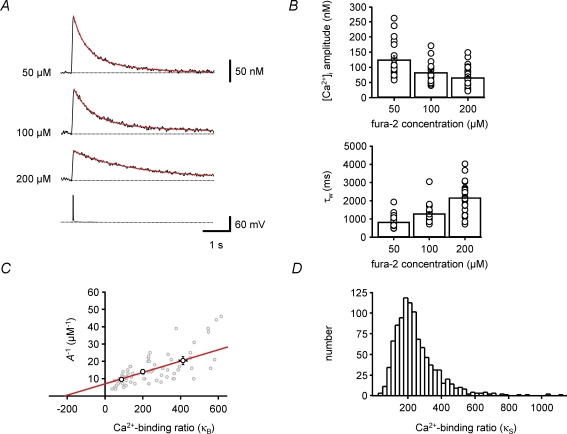
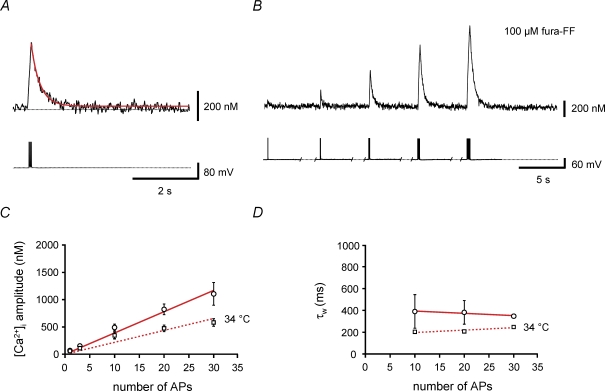
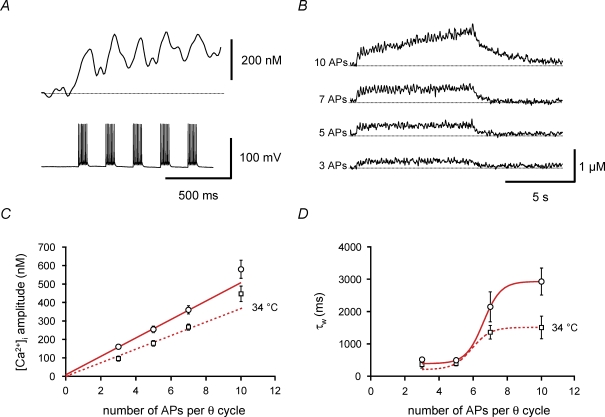
Fast-spiking parvalbumin-expressing basket cells (BCs) represent a major type of inhibitory interneuron in the hippocampus. These cells inhibit principal cells in a temporally precise manner and are involved in the generation of network oscillations. Although BCs show a unique expression profile of Ca(2+)-permeable receptors, Ca(2+)-binding proteins and Ca(2+)-dependent signalling molecules, physiological Ca(2+) signalling in these interneurons has not been investigated. To study action potential (AP)-induced dendritic Ca(2+) influx and buffering, we combined whole-cell patch-clamp recordings with ratiometric Ca(2+) imaging from the proximal apical dendrites of rigorously identified BCs in acute slices, using the high-affinity Ca(2+) indicator fura-2 or the low-affinity dye fura-FF. Single APs evoked dendritic Ca(2+) transients with small amplitude. Bursts of APs evoked Ca(2+) transients with amplitudes that increased linearly with AP number. Analysis of Ca(2+) transients under steady-state conditions with different fura-2 concentrations and during loading with 200 microm fura-2 indicated that the endogenous Ca(2+)-binding ratio was approximately 200 (kappa(S) = 202 +/- 26 for the loading experiments). The peak amplitude of the Ca(2+) transients measured directly with 100 microm fura-FF was 39 nm AP(-1). At approximately 23 degrees C, the decay time constant of the Ca(2+) transients was 390 ms, corresponding to an extrusion rate of approximately 600 s(-1). At 34 degrees C, the decay time constant was 203 ms and the corresponding extrusion rate was approximately 1100 s(-1). At both temperatures, continuous theta-burst activity with three to five APs per theta cycle, as occurs in vivo during exploration, led to a moderate increase in the global Ca(2+) concentration that was proportional to AP number, whereas more intense stimulation was required to reach micromolar Ca(2+) concentrations and to shift Ca(2+) signalling into a non-linear regime. In conclusion, dentate gyrus BCs show a high endogenous Ca(2+)-binding ratio, a small AP-induced dendritic Ca(2+) influx, and a relatively slow Ca(2+) extrusion. These specific buffering properties of BCs will sharpen the time course of local Ca(2+) signals, while prolonging the decay of global Ca(2+) signals.


Figures

Figure 5
Figure 5. Estimation of endogenous Ca2+-binding ratio during loading with the high-affinity indicator fura-2
A, single traces of Ca2+ transients recorded at different time points in a BC during loading with 200 μm fura-2, corresponding to different fura-2 concentrations in the dendrite (as indicated on the left of each trace). Green curves represent monoexponential fits to the decay phase of the Ca2+ transients. Note that the peak amplitude of the Ca2+ transients decreases, while the decay time constant increases during loading. B, plot of fura-2 concentration (upper trace) and simultaneously measured peak amplitude of Ca2+ transients (lower trace) before and after the whole-cell configuration was obtained. Circles indicate the data points corresponding to the traces shown in A. C, plot of the inverse of the peak amplitude of Ca2+ transients against exogenous Ca2+-binding ratio, i.e. the Ca2+-binding ratio of the indicator (κB). The continuous line represents the results of unweighted linear regression. The endogenous Ca2+-binding ratio (κS), estimated from the intercept of the fitted line with the horizontal axis, was 186 in this BC. Data in AC were obtained from the same cell. D, histograms of endogenous Ca2+-binding ratio (κS, upper graph) and amplitude of dendritic Ca2+ transient per AP in the absence of fura-2 (A0, lower graph) in 7 BCs. All experiments were performed with 100 Hz bursts of 5 APs.
Figure 1
Figure 1. Identification of parvalbumin-expressing, fast-spiking basket cells in the dentate gyrus
A, infrared differential interference contrast videomicroscopy image of a BC near the border between granule cell layer and hilus. Dotted lines indicate recording pipette. B, fast-spiking AP phenotype of the same BC recorded in the current-clamp configuration during a 800 pA, 1 s current pulse. The mean action potential frequency in this cell was 94 Hz. C, confocal stack projection of a BC filled with biocytin and stained with FITC-conjugated avidin. The axon is mainly located in the granule cell layer. D, immunohistochemistry of the same BC with an antibody against parvalbumin. Inset: overlay of biocytin signal and parvalbumin immunoreactivity, showing that the recorded cell is parvalbumin positive.
Figure 2
Figure 2. Ca2+ transients in proximal apical dendrites of BCs evoked by single spikes and trains of APs
A, fluorescence image of a BC filled with 100 μm fura-2 (excitation wavelength 380 nm), shown together with an overview of the morphology of the same cell filled with biocytin and stained with FITC-conjugated avidin (large image). Rectangle indicates the region of interest used for imaging of Ca2+ transients. B and C, Ca2+ transients in the proximal apical dendrite evoked by single APs (B) or trains of 10 APs at 50 Hz (C). Upper traces, single consecutive sweeps; middle traces, average of 10 sweeps; lower traces, corresponding APs evoked by brief current pulses. Green curves represent monoexponential fits, red curves biexponential fits to the decay phase of the Ca2+ transients. Data in AC were obtained from the same BC. D, plot of peak amplitude of Ca2+ transient against recording time in the same cell shown in AC (upper graph) and against distance (measured from the border of the soma to the centre of the region of interest) in a subset of BCs in which measurements were made at multiple distances. Data from the same cell are connected by gray dotted lines. Continuous red lines represent the results of linear regression.
Figure 3
Figure 3. Linear summation of Ca2+ transients evoked by different numbers of action potentials
A, Ca2+ transients in the apical dendrite of a BC filled with 100 μm fura-2 evoked by a single AP or 100 Hz bursts of 3, 10, 20 and 30 APs. Upper traces, averages of 20 sweeps; lower traces, corresponding APs and trains of APs evoked by brief current pulses. B, plot of peak amplitude of Ca2+ transients against the number of APs. Continuous curve represents the results of linear regression, yielding a steepness of 24 nm AP−1. C, plot of amplitude-weighted decay time constant (τw) of the Ca2+ transients against the number of APs. Note that τw is almost independent of the number of spikes. Continuous curve represents the results of linear regression, yielding a steepness of −5 ms AP−1. Data from 18 BCs loaded with 100 μm fura-2.
Figure 4
Figure 4. Estimation of endogenous Ca2+-binding ratio by population analysis under steady-state conditions
A, Ca2+ transients evoked by 100 Hz bursts of 5 APs. Three different BCs were loaded with fura-2, with dye concentrations indicated on the left. Each Ca2+ transient trace is an average of 20 single sweeps. The lower trace represents the corresponding AP train. Red curves represent biexponential fits to the decay phase of the Ca2+ transients. Note that peak amplitude of the Ca2+ transients decreases, whereas the decay time constant increases with increasing concentration of fura-2, indicating competition between fura-2 and endogenous Ca2+ buffers. B, summary bar graphs showing the peak amplitude (upper graph) and amplitude-weighted decay time constant (τw, lower graph) of Ca2+ transients evoked by 100 Hz bursts of 5 APs at different concentrations of fura-2. Bars represent mean ±s.e.m.; circles represent data from individual BCs. C, plot of the inverse of the peak amplitude of Ca2+ transients against the exogenous Ca2+-binding ratio, i.e. the Ca2+-binding ratio of fura-2 (κB). κB was calculated from the fura-2 concentration according to eqn (3). Gray circles, data from 66 individual BCs; black circles, plot of mean values for 50, 100 and 200 μm fura-2. Continuous line represents the results of unweighted linear regression to the mean data. The endogenous Ca2+-binding ratio (κS), estimated from the intercept of the fitted line with the horizontal axis, was 214. D, estimation of confidence intervals for κS. 1000 bootstrap replications of the original mean data were generated and corresponding κS values were determined by linear regression (see Methods). The histogram shows the distribution of estimated κS values. The 15.9–84.1% confidence interval was [138, 355]. Measurements were taken > 10 min after the whole-cell configuration was established.
Figure 6
Figure 6. Direct measurement of the amplitude of Ca2+ transients and the Ca2+ extrusion rate with the low-affinity indicator fura-FF
A and B, Ca2+ transients recorded in the proximal apical dendrite of a BC filled with 100 μm fura-FF. Upper traces, average Ca2+ transients (mean of 10 sweeps); lower traces, corresponding APs evoked by brief current pulses. A, Ca2+ transients evoked by a 100 Hz train of 10 APs; B, Ca2+ transients evoked by a single AP or 100 Hz trains of 3, 10, 20 and 30 APs. C, plot of peak amplitude of Ca2+ transients against the number of APs. ○, data obtained at 22–24°C; □, measurements taken at 34°C. Continuous and dashed lines represent the results of linear regression analysis of the two data sets, yielding steepness values of 39 nm AP−1 and 22 nm AP−1, respectively. D, plot of amplitude-weighted decay time constant (τw) of the Ca2+ transients against the number of APs. Data for 1 and 3 APs were omitted, because decay time constants could not be measured reliably. Note that τw is almost independent of the number of APs used as stimulus. ○, data obtained at 22–24°C; □, measurements taken at 34°C. Continuous and dashed lines represent the results of linear regression, yielding steepness values of −2.2 ms AP−1 and 2.2 ms AP−1, respectively. Data from 7 BCs (22–24°C) and 12 BCs (34°C) filled with 100 μm fura-FF.
Figure 7
Figure 7. Switch from linear to supralinear Ca2+ signalling during repetitive theta-burst stimulation
A and B, Ca2+ transients recorded in the proximal apical dendrite of a BC filled with 100 μm fura-FF. A, expanded view of Ca2+ transients evoked at the onset of repetitive 100 Hz burst stimulation. The number of APs per burst was 7, and the burst repetition frequency was 5 Hz. Upper trace, average Ca2+ transient; lower trace, corresponding APs evoked by brief current pulses. B, Ca2+ transients evoked by repetitive 100 Hz burst stimulation for 8 s with 3, 5, 7 or 10 APs per burst (as indicated on the left of each trace). The burst repetition frequency was 5 Hz. Traces of Ca2+ transients in A and B are averages of 5 individual sweeps. C, plot of mean amplitude of Ca2+ transients against the number of APs. Amplitudes were measured 2–5 s after stimulation onset. ○, data obtained at 22–24°C; □, measurements taken at 34°C. Continuous and dashed lines represent the results of linear regression of the data points for 3, 5 and 7 APs, yielding steepness values of 50 nm AP−1 and 37 nm AP−1, respectively. D, plot of amplitude-weighted average decay time constant (τw) of the Ca2+ transients after the end of stimulation against the number of APs per burst. Note that τw is similar for 3 and 5 APs, but increases markedly for a larger number of APs. ○, data obtained at 22–24°C; □, measurements taken at 34°C. Continuous and dashed curves represent non-linear fits with a Boltzmann function with a constant offset constrained to the mean τw for a single burst of 10 APs. Data from 8 BCs (22–24°C) and 7 BCs (34°C) filled with 100 μm fura-FF.

Comment in

  • Details of Ca2+ dynamics matter.
    Neher E. Neher E. J Physiol. 2008 Apr 15;586(8):2031. doi: 10.1113/jphysiol.2008.153080. J Physiol. 2008. PMID: 18413335 Free PMC article. No abstract available.

References

    1. Alle H, Jonas P, Geiger JRP. PTP and LTP at a hippocampal mossy fiber-interneuron synapse. Proc Natl Acad Sci U S A. 2001;98:14708–14713. - PMC - PubMed
    1. Aponte Y, Lien CC, Bischofberger J, Jonas P. Dendritic calcium signaling in fast-spiking hippocampal basket cells. Abstr Soc Neurosci. 2006a;337.12
    1. Aponte Y, Lien CC, Reisinger E, Jonas P. Hyperpolarization-activated cation channels in fast-spiking interneurons of rat hippocampus. J Physiol. 2006b;574:229–243. - PMC - PubMed
    1. Bartos M, Vida I, Jonas P. Synaptic mechanisms of synchronized gamma oscillations in inhibitory interneuron networks. Nat Rev Neurosci. 2007;8:45–56. - PubMed
    1. Bragin A, Jandó G, Nádasdy Z, Hetke J, Wise K, Buzsáki G. Gamma (40–100 Hz) oscillation in the hippocampus of the behaving rat. J Neurosci. 1995;15:47–60. - PMC - PubMed

Publication types

LinkOut - more resources