. 2008:4:165.
doi: 10.1038/msb4100203. Epub 2008 Feb 12.

Accurate prediction of protein-protein interactions from sequence alignments using a Bayesian method

Affiliations

Accurate prediction of protein-protein interactions from sequence alignments using a Bayesian method

Lukas Burger et al. Mol Syst Biol. 2008.

Abstract

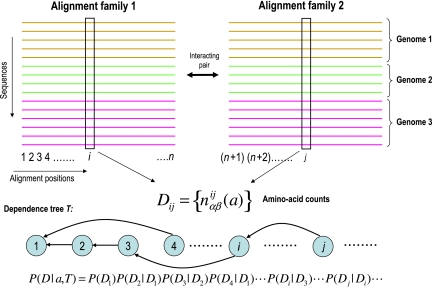
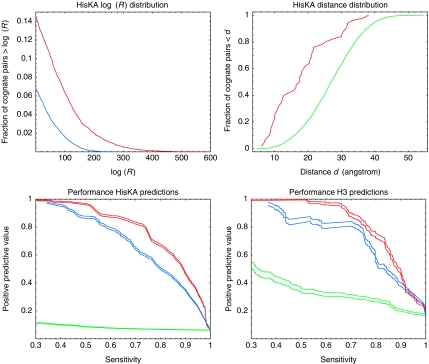
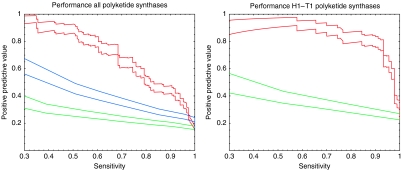
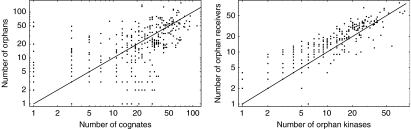
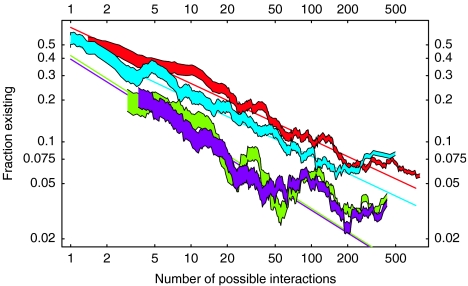
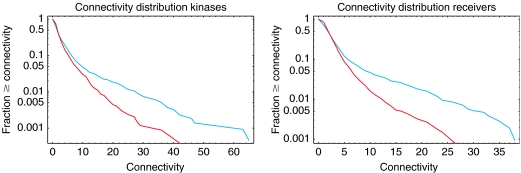
Accurate and large-scale prediction of protein-protein interactions directly from amino-acid sequences is one of the great challenges in computational biology. Here we present a new Bayesian network method that predicts interaction partners using only multiple alignments of amino-acid sequences of interacting protein domains, without tunable parameters, and without the need for any training examples. We first apply the method to bacterial two-component systems and comprehensively reconstruct two-component signaling networks across all sequenced bacteria. Comparisons of our predictions with known interactions show that our method infers interaction partners genome-wide with high accuracy. To demonstrate the general applicability of our method we show that it also accurately predicts interaction partners in a recent dataset of polyketide synthases. Analysis of the predicted genome-wide two-component signaling networks shows that cognates (interacting kinase/regulator pairs, which lie adjacent on the genome) and orphans (which lie isolated) form two relatively independent components of the signaling network in each genome. In addition, while most genes are predicted to have only a small number of interaction partners, we find that 10% of orphans form a separate class of 'hub' nodes that distribute and integrate signals to and from up to tens of different interaction partners.


Figures

Figure 1
Figure 1
Illustration of the model used to assign a probability P(Da) to the joint multiple sequence alignment D of two protein families given an assignment a of interaction partners between them. Sequences from the same genome have the same color and horizontally aligned sequences are assumed to interact. The probabilities of pairs of alignment columns (ij) depend on the number of times nαβij that amino acids (αβ) occur in the corresponding columns. A dependence tree T and the corresponding factorization of the probability P(Da, T) of the entire alignment given the assignment and dependence tree is illustrated at the bottom of the figure.
Figure 2
Figure 2
Analysis of cognate pairs for the HisKA and H3 kinase classes. Top left panel: The red line shows the tail of the reverse cumulative distribution of log(Rij) (dependency) values for pairs of positions in cognate HisKA kinase/receiver pairs. The blue line shows the tail of the log(Rij) distribution after randomizing kinase/receiver assignments in such a way that all phylogenetic relationships are maintained. Top right panel: The cumulative distribution of estimated (see the text) distances between the amino acids in the co-crystal for the 50 pairs with highest R values (red line) versus all other pairs (green line). Bottom left panel: Sensitivities and positive predictive values of the predictions for cognate HisKA kinases and regulators. The red curves show the performance of the model in which P(Da, T) is averaged over all dependence trees, the blue curve shows the performance of the model P(Da, T*) that uses only the best dependence tree, and the green line shows the performance of random predictions. All pairs of curves show estimated PPV±one standard error. Bottom right panel: Performance results as in the bottom left panel for cognate H3 kinases and regulators.
Figure 3
Figure 3
Complex of the histidine phosphotransferase Spo0B (yellow) with the response regulator Spo0F (green) (Zapf et al, 2000). Only one half of the Spo0B dimer is shown. The site of autophosphorylation in Spo0B and the phosphorylation site in Spo0F are shown in blue. Out of the 20 HisKA/receiver pairs of residues with highest log(Rij), 17 are shown as black lines (three cannot be displayed because the residues fall in gaps of the alignment with Spo0B). Amino acids marked in red are part of at least one of these 17 pairs.
Figure 4
Figure 4
Performance of predicted head–tail interactions for PKSs. Left panel: Sensitivities and positive predictive values of the predictions for all PKSs in the data set of Thattai et al (2007). The performance of our model in which P(Da, T) is averaged over all dependence trees is shown in red. The blue curve shows the performance if only the class information of heads and tails is used (see Materials and methods) and the green line shows the performance of random predictions. All pairs of curves show estimated PPV±one standard error. Right panel: Same as the left panel, but predictions restricted to the H1–T1 subclass.
Figure 5
Figure 5
Total numbers of cognates, orphan kinases, and orphan regulators across 399 sequenced bacterial genomes. Left panel: The total number of cognates (horizontal axis) versus the total number of orphans (vertical axis). Right panel: The number of orphan kinases (horizontal axis) versus the number of orphan regulators (vertical axis). Each dot in each panel corresponds to a genome. All axes are shown on logarithmic scale. To be able to show genomes with zero genes in one or more of the categories, 1 was added to each count, that is, one on the axis corresponds to a count of zero.
Figure 6
Figure 6
The fractions of interactions between cognates (red), between orphan kinases and orphan regulators (light blue), between cognate kinases and orphan regulators (green), and between orphan kinases and cognate regulators (purple) that are predicted to exist (vertical axis), as a function of the total number of possible interactions (horizontal axis). Both axes are shown on logarithmic scales. The values on the vertical axis were obtained by ordering genomes by the total number of interactions of each type, and taking running averages over 25 consecutive genomes. The widths of the curves correspond to two standard errors. The straight lines are power-law fits to the raw data and are given by fcc=0.63T−0.4, foo=0.50T−0.38, fco=0.41T−0.55, and foc=0.39T−0.55.
Figure 7
Figure 7
Reverse cumulative connectivity distributions of kinases (left panel) and receivers (right panel). The fraction of genes with at least a given number of interaction partners (connectivity) is shown as a function of the connectivity. Cognates are shown in red and orphans in blue. The vertical axis is shown on a logarithmic scale.

References

    1. Alm E, Huang K, Arkin A (2006) The evolution of two-component systems in bacteria reveals different strategies for niche adaptation. PLoS Comp Biol 2: e143 - PMC - PubMed
    1. Ausmees N, Jacobs-Wagner C (2003) Spatial and temporal control of differentiation and cell cycle progression in Caulobacter crescentus. Annu Rev Microbiol 57: 225–247 - PubMed
    1. Bateman A, Coin L, Durbin R, Finn R, Hollich V, Griffiths-Jones S, Khanna A, Marshall M, Moxon S, Sonnhammer E, Studholme D, Yeats C, Eddy S (2004) The Pfam protein families database. Nucleic Acids Res 32: D138–D141 - PMC - PubMed
    1. Biondi E, Reisinger S, Skerker J, Arif M, Perchuk B, Ryan K, Laub M (2006) Regulation of the bacterial cell cycle by an integrated genetic circuit. Nature 444: 899–904 - PubMed
    1. Bork P, Jensen L, von Mering C, Ramani A, Lee I, Marcotte E (2004) Protein interaction networks from yeast to human. Curr Opin Struct Biol 14: 292–299 - PubMed

MeSH terms