

Predicting synthetic rescues in metabolic networks
- PMID: 18277384
- PMCID: PMC2267730
- DOI: 10.1038/msb.2008.1
Predicting synthetic rescues in metabolic networks
Abstract
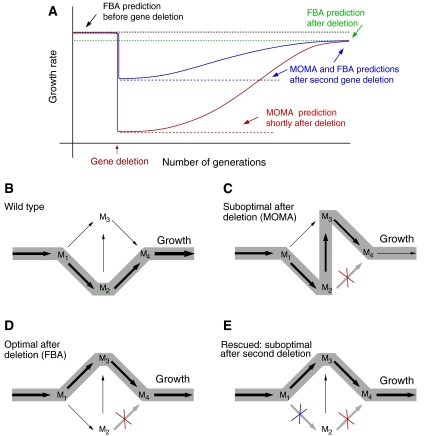
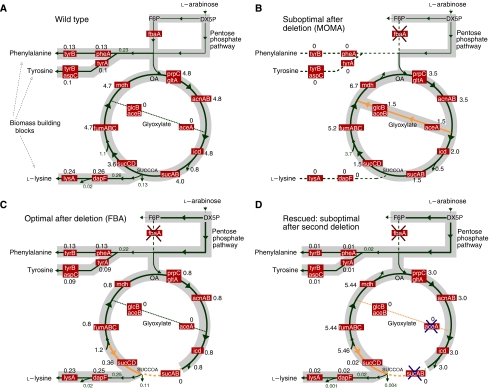
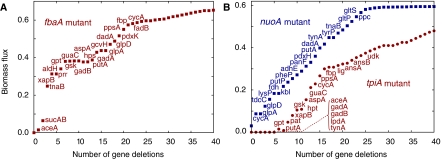
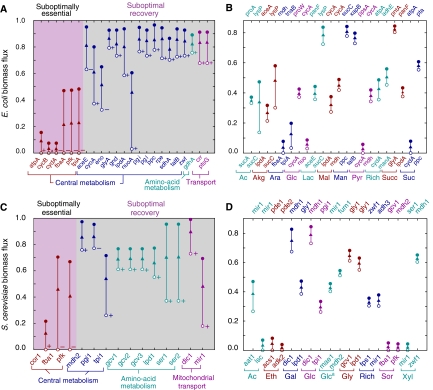
An important goal of medical research is to develop methods to recover the loss of cellular function due to mutations and other defects. Many approaches based on gene therapy aim to repair the defective gene or to insert genes with compensatory function. Here, we propose an alternative, network-based strategy that aims to restore biological function by forcing the cell to either bypass the functions affected by the defective gene, or to compensate for the lost function. Focusing on the metabolism of single-cell organisms, we computationally study mutants that lack an essential enzyme, and thus are unable to grow or have a significantly reduced growth rate. We show that several of these mutants can be turned into viable organisms through additional gene deletions that restore their growth rate. In a rather counterintuitive fashion, this is achieved via additional damage to the metabolic network. Using flux balance-based approaches, we identify a number of synthetically viable gene pairs, in which the removal of one enzyme-encoding gene results in a non-viable phenotype, while the deletion of a second enzyme-encoding gene rescues the organism. The systematic network-based identification of compensatory rescue effects may open new avenues for genetic interventions.
Figures
Similar articles
-
Utilizing elementary mode analysis, pathway thermodynamics, and a genetic algorithm for metabolic flux determination and optimal metabolic network design.BMC Syst Biol. 2010 Apr 23;4:49. doi: 10.1186/1752-0509-4-49. BMC Syst Biol. 2010. PMID: 20416071 Free PMC article.
-
Metabolic flux balance analysis and the in silico analysis of Escherichia coli K-12 gene deletions.BMC Bioinformatics. 2000;1:1. doi: 10.1186/1471-2105-1-1. Epub 2000 Jul 27. BMC Bioinformatics. 2000. PMID: 11001586 Free PMC article.
-
Three factors underlying incorrect in silico predictions of essential metabolic genes.BMC Syst Biol. 2008 Feb 4;2:14. doi: 10.1186/1752-0509-2-14. BMC Syst Biol. 2008. PMID: 18248675 Free PMC article.
-
Essential genes on metabolic maps.Curr Opin Biotechnol. 2006 Oct;17(5):448-56. doi: 10.1016/j.copbio.2006.08.006. Epub 2006 Sep 15. Curr Opin Biotechnol. 2006. PMID: 16978855 Review.
-
Advances in the integration of transcriptional regulatory information into genome-scale metabolic models.Biosystems. 2016 Sep;147:1-10. doi: 10.1016/j.biosystems.2016.06.001. Epub 2016 Jun 7. Biosystems. 2016. PMID: 27287878 Review.
Cited by
-
Antagonistic Phenomena in Network Dynamics.Annu Rev Condens Matter Phys. 2018 Mar;9:463-484. doi: 10.1146/annurev-conmatphys-033117-054054. Annu Rev Condens Matter Phys. 2018. PMID: 30116502 Free PMC article.
-
Evolutionary constraints permeate large metabolic networks.BMC Evol Biol. 2009 Sep 11;9:231. doi: 10.1186/1471-2148-9-231. BMC Evol Biol. 2009. PMID: 19747381 Free PMC article.
-
Evolutionary plasticity and innovations in complex metabolic reaction networks.PLoS Comput Biol. 2009 Dec;5(12):e1000613. doi: 10.1371/journal.pcbi.1000613. Epub 2009 Dec 18. PLoS Comput Biol. 2009. PMID: 20019795 Free PMC article.
-
Systems-level engineering of nonfermentative metabolism in yeast.Genetics. 2009 Sep;183(1):385-97. doi: 10.1534/genetics.109.105254. Epub 2009 Jun 29. Genetics. 2009. PMID: 19564482 Free PMC article.
-
Trade-offs between robustness and small-world effect in complex networks.Sci Rep. 2016 Nov 17;6:37317. doi: 10.1038/srep37317. Sci Rep. 2016. PMID: 27853301 Free PMC article.
References
-
- Albert R (2005) Scale-free networks in cell biology. J Cell Sci 118: 4947–4957 - PubMed
-
- Barabási A-L (2007) Network medicine—from obesity to the ‘diseasome'. N Engl J Med 357: 404–407 - PubMed
-
- Barabási A-L, Oltvai ZN (2004) Network biology: understanding the cell's functional organization. Nat Rev Genet 5: 101–113 - PubMed
-
- BiGG (2007) Database of Biochemically, Genetically and Genomically (BiGG) Structured Genome-Scale Metabolic Network Reconstruction. Available online at: http://bigg.ucsd.edu/
Publication types
MeSH terms
Grants and funding
LinkOut - more resources
Full Text Sources
Other Literature Sources
