. 2008 Mar;14(3):337-42.
doi: 10.1038/nm1715. Epub 2008 Feb 17.

Differential regulation of central nervous system autoimmunity by T(H)1 and T(H)17 cells

Affiliations

Differential regulation of central nervous system autoimmunity by T(H)1 and T(H)17 cells

Ingunn M Stromnes et al. Nat Med. 2008 Mar.

Abstract

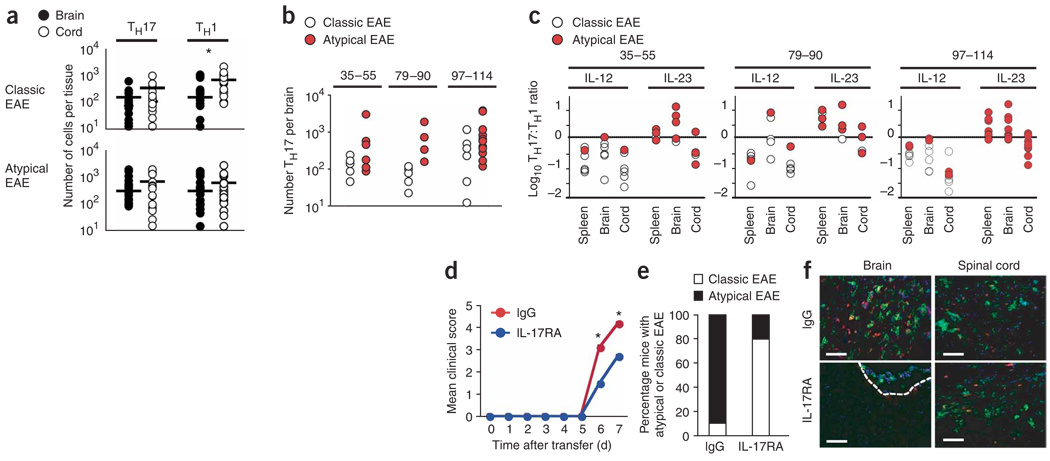
Multiple sclerosis is an inflammatory, demyelinating disease of the central nervous system (CNS) characterized by a wide range of clinical signs. The location of lesions in the CNS is variable and is a crucial determinant of clinical outcome. Multiple sclerosis is believed to be mediated by myelin-specific T cells, but the mechanisms that determine where T cells initiate inflammation are unknown. Differences in lesion distribution have been linked to the HLA complex, suggesting that T cell specificity influences sites of inflammation. We demonstrate that T cells that are specific for different myelin epitopes generate populations characterized by different T helper type 17 (T(H)17) to T helper type 1 (T(H)1) ratios depending on the functional avidity of interactions between TCR and peptide-MHC complexes. Notably, the T(H)17:T(H)1 ratio of infiltrating T cells determines where inflammation occurs in the CNS. Myelin-specific T cells infiltrate the meninges throughout the CNS, regardless of the T(H)17:T(H)1 ratio. However, T cell infiltration and inflammation in the brain parenchyma occurs only when T(H)17 cells outnumber T(H)1 cells and trigger a disproportionate increase in interleukin-17 expression in the brain. In contrast, T cells showing a wide range of T(H)17:T(H)1 ratios induce spinal cord parenchymal inflammation. These findings reveal critical differences in the regulation of inflammation in the brain and spinal cord.


Figures

Figure 1
Figure 1
CNS autoimmunity differs in C3H MHC congenic mice. (a) Clinical course of EAE in C3H.SW (left, n = 11) and C3HeB/Fej (right, n = 13) mice. C3H.SW mice were scored according to a classic EAE scale and C3HeB/Fej mice were scored using an atypical EAE scale. Results are representative of two experiments. (b) Immunopathology of CNS tissues from mice killed at onset of EAE. Immunochemically stained CD4+ and F4/80+ cells were detected as brown foci. Pale-staining regions of Luxol-Fast Blue–stained sections demonstrate areas of myelin loss (arrows).
Figure 2
Figure 2
T cell skewing toward a TH17 or TH1 phenotype directs inflammation to the brain or spinal cord. (a) Representative CD4 (red) and F4/80 (green) staining of cerebellum and lumbar spinal cord sections of F1 recipients of epitope-specific T cells (the atypical:classic EAE ratios were rMOG, 3:0; MOG35–55, 0:6; MOG79–90, 2:7; MOG97–114, 11:0). Scale bar, 200 µm. (b) The distribution of inflammation between brain and spinal cord, as quantified by image analysis software, was significantly different for all specificities (P < 0.0001). Error bars indicate s.d. (c) Percentage of F1 recipients showing atypical or classic EAE after transfer of T cells cultured with either peptide alone, peptide and IL-12, or peptide and IL-23 (n = 5–11 recipients per group). Some IL-23–skewed T cell recipients with atypical EAE also showed tail paralysis (3/10, 2/5 and 4/6 for MOG97–114-, MOG79–90- and MOG35–55-specific T cells, respectively). Atypical EAE incidence was significantly higher for non-skewed MOG97–114- compared with MOG79–90- (P = 0.0001) and MOG35–55-specific T cells (P = 0.0003). The difference in disease phenotype induced by IL-23– and IL-12–skewed cells was significant (P = 7.7 × 10⁻¹⁹). (d) Immunohistochemical staining for CD4+ and F4/80+ cells in representative brain and spinal cord sections from IL-12– or IL-23–skewed MOG97–114-specific T cell recipients. Scale bar, 200 µm. (e) Flow cytometric analyses of recipients in c revealed significantly more CD4+, F4/80+, Gr-1+ and CD11c+ cells in the brains of atypical compared with classic EAE mice (P ≤ 0.04). Error bars represent s.e.m.
Figure 3
Figure 3
IL-17 activity triggered by high TH17:TH1 ratios in the brain is required for parenchymal brain inflammation. (a) The numbers of MOG-specific TH17 and TH1 cells in brain and spinal cord of F1 recipients with atypical or classic EAE determined at disease onset by ELISPOT. Each circle represents an individual mouse. *P = 0.005. (b) Epitope-specific TH17 cell numbers in the brains of IL-12– or IL-23–skewed T cell recipients with either classic or atypical EAE, respectively. Differences between atypical versus classic EAE were observed only for MOG79–90 recipients (P = 0.03). (c) The log10 TH17:TH1 ratios in the spleen, brain and spinal cord of F1 recipients of either IL-12– or IL-23–skewed epitope-specific T cells. Correlation of TH17:TH1 ratios >1 with atypical disease and <1 with classic disease was highly significant (P = 5 × 10⁻⁹). (d) Mean clinical course of TH17-biased MOG97–114 T cell recipients receiving either IL-17RA–Fc protein (scores are for classic EAE) or purified mouse IgG (scores are for atypical EAE). Data are pooled from two independent experiments (n = 10 mice per group). Mean clinical scores at day 6 and 7 post-transfer were significantly different (P < 0.008). Because of disease severity, control mice receiving IgG were killed at d 7. (e) The percentage of classic or atypical EAE observed for each group in d. (f) Representative images of brain and spinal cord sections stained with CD4 (red), F4/80 (green) and DAPI (blue). Dashed white line represents boundary between meninges and parenchyma. Scale bars, 5 µm.
Figure 4
Figure 4
TH17:TH1 ratio of epitope-specific T cells is influenced by functional avidity. (a) TH17:TH1 ratio of MOG-epitope specific T cells from spleens of rMOG-primed F1 mice determined by ELISPOT (each circle represents an individual mouse). (b) Representative dose response of rMOG-primed T cells to MOG peptides. MOG97–114-specific T cells showed a significantly higher functional avidity compared with the other specificities (P < 0.05, n = 19 experiments). (c) Proliferation of MBPAc1–11-specific TCR transgenic T cells in response to MBPAc1–11 and MBPAc1–11Met4Lys8 peptides. (d) TH17:TH1 ratios of MBPAc1–11Met4Lys8- and MBPAc1–11-specific T cells isolated from spleens of B10.PL mice immunized with either MBPAc1–11 or MBPAc1–11Met4Lys8 were determined by ELISPOT. *P < 0.05. Error bars represent s.d.

References

    1. Sospedra M, Martin R. Immunology of multiple sclerosis. Annu. Rev. Immunol. 2005;23:683–747. - PubMed
    1. Fukazawa T, et al. Both the HLA-CPB1 and -DRB1 alleles correlate with risk for multiple sclerosis in Japanese: clinical phenotypes and gender as important factors. Tissue Antigens. 2000;55:199–205. - PubMed
    1. Raine C. The lesion in multiple sclerosis and chronic relapsing experimental allergic encephalomyelitis: a structural comparison. In: Raine CS, McFarland HF, Tourtellotte WW, editors. Multiple Sclerosis: Clinical and Pathogenetic Basis. London: Chapman and Hall; 1997. pp. 243–286.
    1. Storch MK, et al. Autoimmunity to myelin oligodendrocyte glycoprotein in rats mimics the spectrum of multiple sclerosis pathology. Brain Pathol. 1998;8:681–694. - PMC - PubMed
    1. Tsunoda I, Kuang LQ, Theil DJ, Fujinami RS. Antibody association with a novel model for primary progressive multiple sclerosis: induction of relapsing-remitting and progressive forms of EAE in H2s mouse strains. Brain Pathol. 2000;10:402–418. - PMC - PubMed

Publication types