. 2007 Oct:51:17-80.
doi: 10.4271/2007-22-0002.

A study of the response of the human cadaver head to impact

Affiliations

A study of the response of the human cadaver head to impact

Warren N Hardy et al. Stapp Car Crash J. 2007 Oct.

Abstract

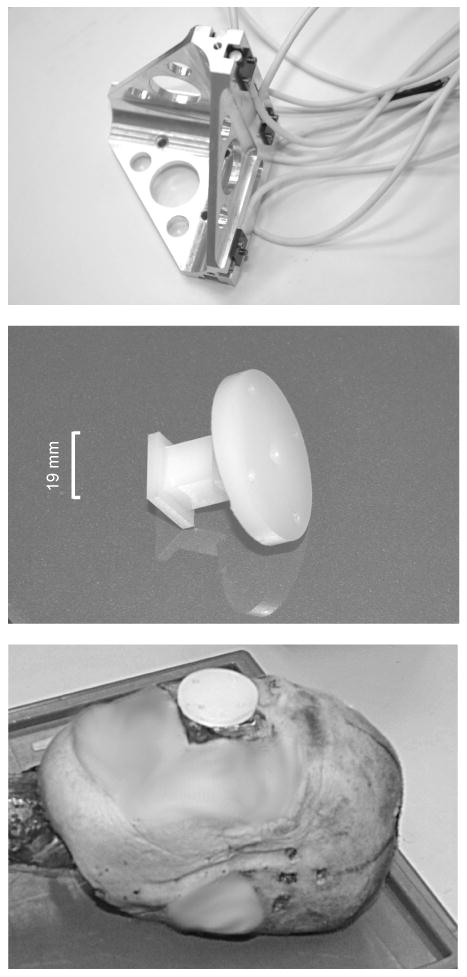
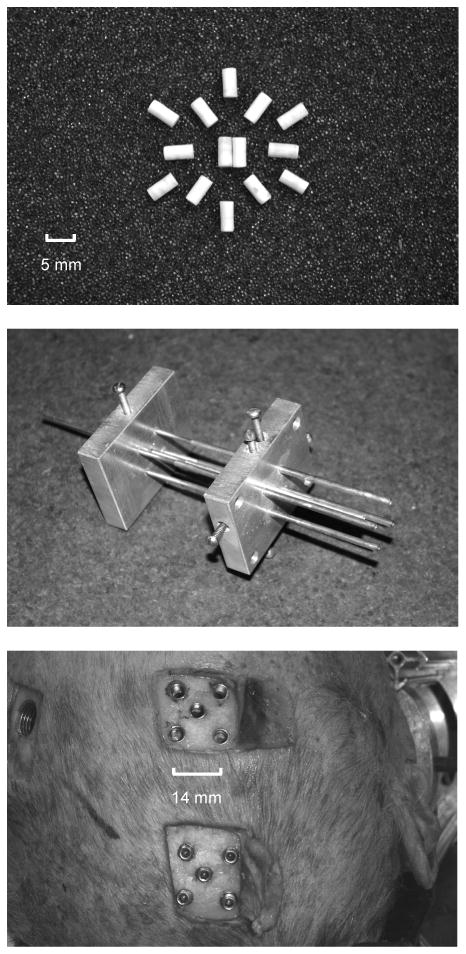
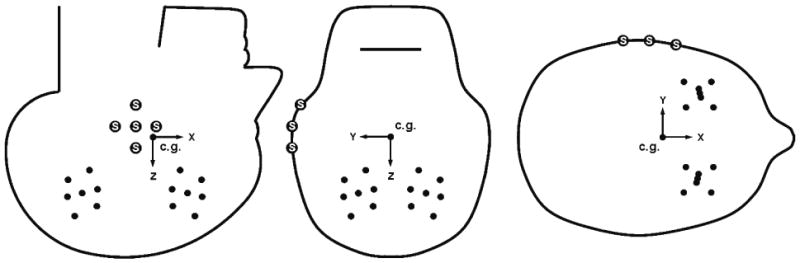
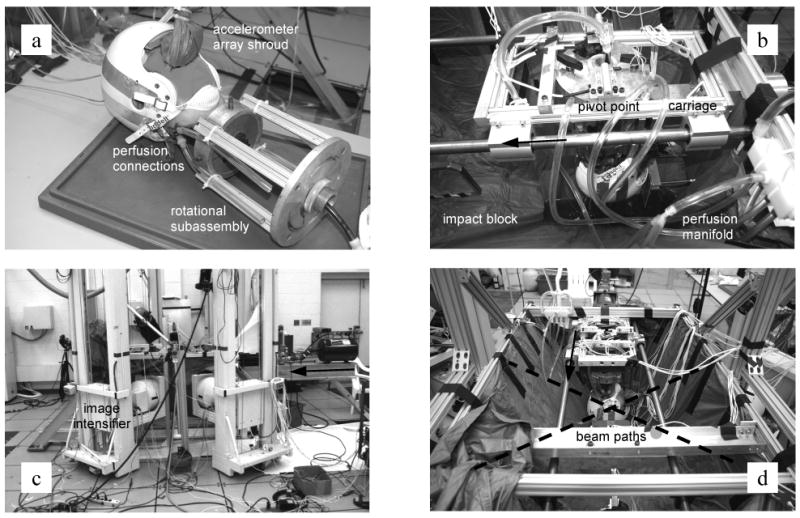
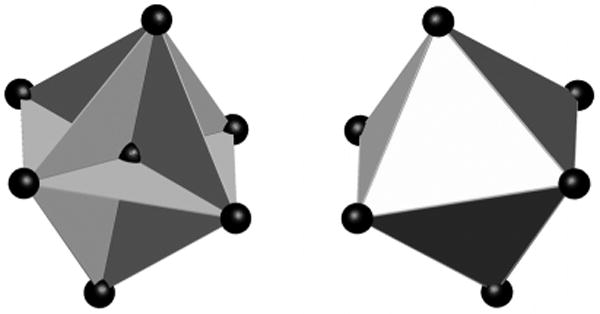
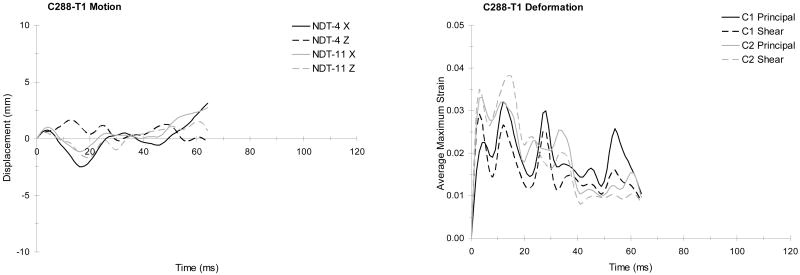
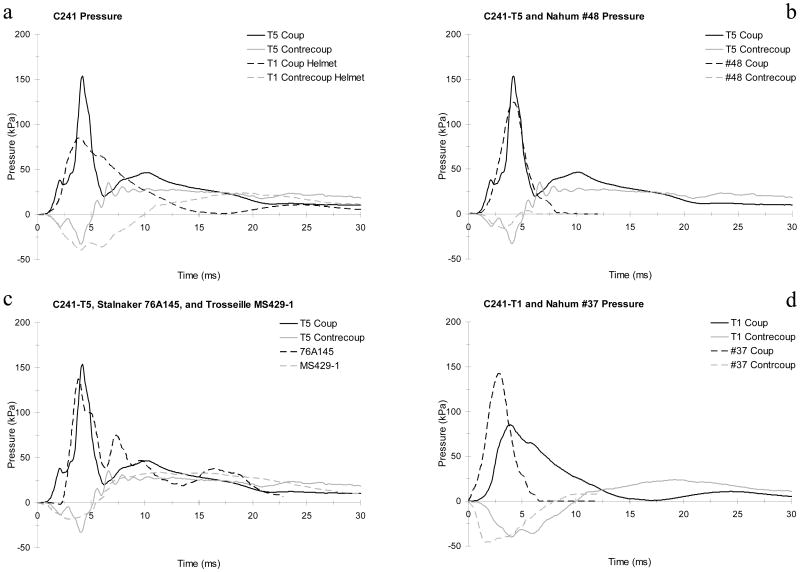
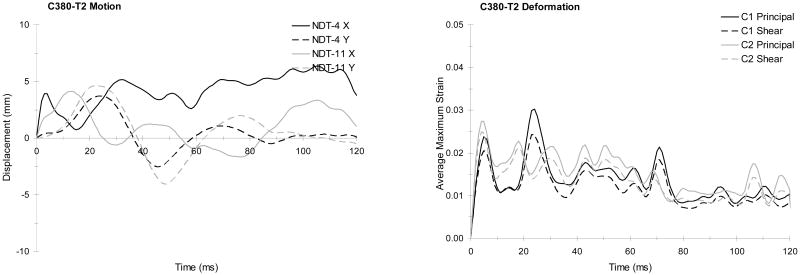
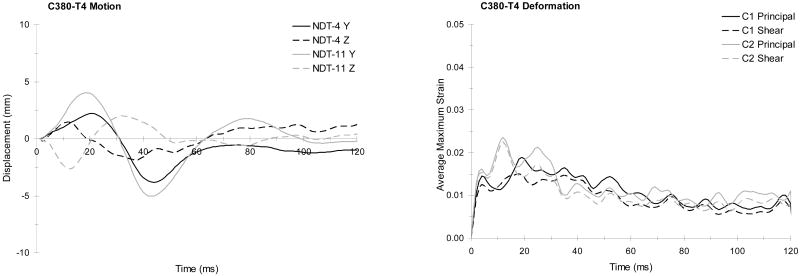
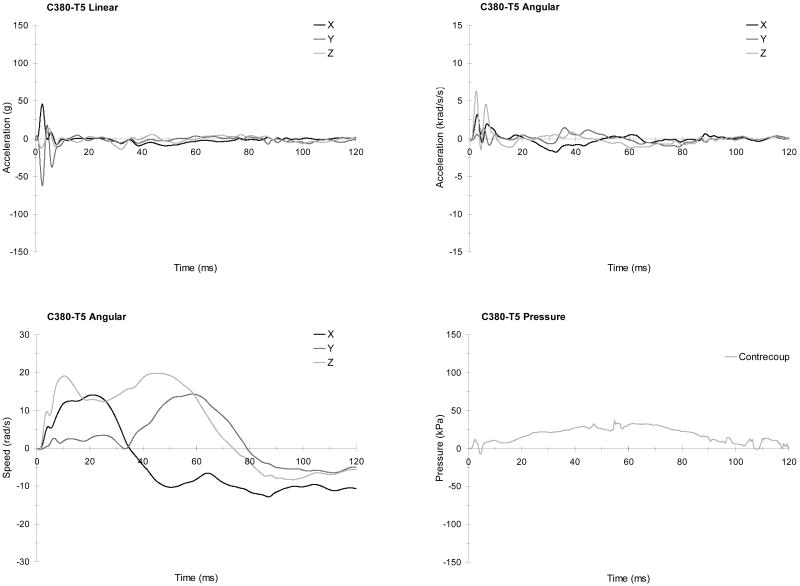
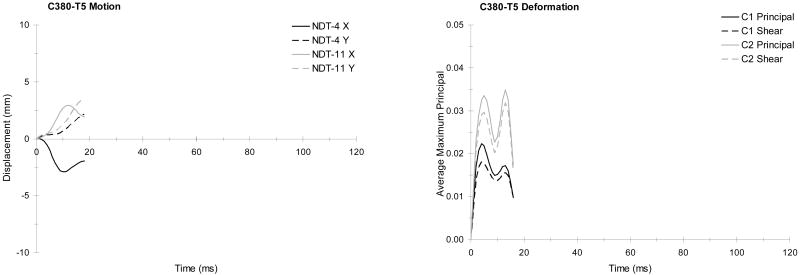
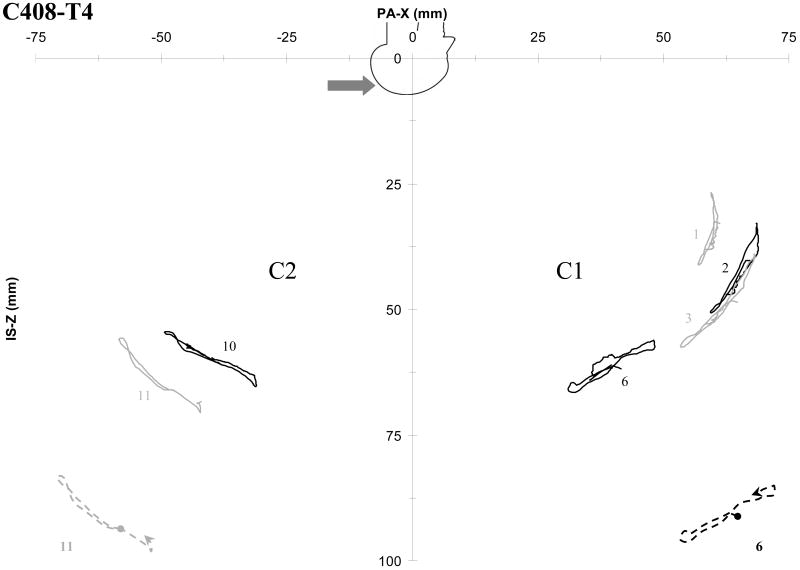
High-speed biplane x-ray and neutral density targets were used to examine brain displacement and deformation during impact. Relative motion, maximum principal strain, maximum shear strain, and intracranial pressure were measured in thirty-five impacts using eight human cadaver head and neck specimens. The effect of a helmet was evaluated. During impact, local brain tissue tends to keep its position and shape with respect to the inertial frame, resulting in relative motion between the brain and skull and deformation of the brain. The local brain motions tend to follow looping patterns. Similar patterns are observed for impact in different planes, with some degree of posterior-anterior and right-left symmetry. Peak coup pressure and pressure rate increase with increasing linear acceleration, but coup pressure pulse duration decreases. Peak average maximum principal strain and maximum shear are on the order of 0.09 for CFC 60 Hz data for these tests. Peak average maximum principal strain and maximum shear decrease with increasing linear acceleration, coup pressure, and coup pressure rate. Linear and angular acceleration of the head are reduced with use of a helmet, but strain increases. These results can be used for the validation of finite element models of the human head.


Figures

FIGURE 1
FIGURE 1
The tetrahedral nine-accelerometer array used to measure head kinematics and its associated attachment techniques. The tetrahedral array loaded with Endevco 7264C-2kTZ accelerometers (top), the Nylon® pedestal used to fix the accelerometer array to the skull (middle), the pedestal installed in the maxillary sinus of C393 using Dynacast as a potting compound (bottom).
FIGURE 2
FIGURE 2
A cranial pressure transducer (CPT) and associated implanting techniques. An Entran EPB-B02-500P CPT (top), a representative trephine and connector sealing system (middle), and a trephine seal installed in specimen C064 with transducer cable attached and sealed with silicone (bottom). An installed seal prior to cable connection and silicone application (bottom inset).
FIGURE 3
FIGURE 3
Neutral Density Targets (NDTs) and associated implanting techniques: The NDT collection (top), the NDT implant cannula fixture (middle), and representative sealed and unsealed trephine arrays (bottom) in the skull of C015 through which NDTs are implanted using the cannula fixture.
Figure 4
Figure 4
Representative instrumentation x-rays (lateral and AP) from specimen C288 prepared for an occipital impact in the median plane, showing the NDT clusters, CPT locations, skull markers, trephine seals, and the phantom defining the nine accelerometer array origin and orientation.
FIGURE 5
FIGURE 5
The general NDT cluster implanting schemes for tests involving impact in the median plane (left), coronal plane (center), and horizontal plane (right). There are 7 targets in each cluster. The large “S” markers are attached to the skull and define the body-fixed basis. The anatomical coordinate system is defined with its origin at the head c.g., with the positive X direction toward the face (anterior), the positive Y direction toward the left (lateral), and the positive Z direction toward the top of the head (superior).
FIGURE 6
FIGURE 6
Test configuration aspects. A representative preparation (C393) with a helmet showing the specimen attached to the rotational subassembly, perfusion connections, and shrouded nine accelerometer array (a), a representative test configuration (C472) for impact in the median plane showing the carriage fixture, impact block, and perfusion system components (b), the high-speed biplane x-ray facility with the pneumatic impactor and specimen fixtures in place between the two image intensifiers (c), and a representative test configuration (C393) for impact in the coronal plane showing the aCSF containment tarpaulin and x-ray beam paths (d). The arrows indicate the direction of carriage travel.
FIGURE 7
FIGURE 7
The NDT triad configurations used for maximum principal and shear strain calculation. When the center target is available, up to twelve triads are formed (left). When the center target data are missing, up to eight triads are formed (right).
FIGURE 8
FIGURE 8
Brain motion patterns for two NDT clusters for helmeted test C288-T1 for an aligned occipital impact.
FIGURE 9
FIGURE 9
The head responses from test C288-T1 (aligned occipital impact with a helmet): Linear accelerations (upper left), angular accelerations (upper right), angular speeds (lower left), and pressure response (lower right).
FIGURE 10
FIGURE 10
The brain responses from test C288-T1 (aligned occipital impact with a helmet): Typical relative displacement time histories referred to starting positions (left), and average maximum principal and shear strain time histories (right).
FIGURE 11
FIGURE 11
Linear regression analyses comparing: Peak coup pressure to peak linear acceleration (a) and peak angular acceleration (b), peak rate of change of coup pressure to linear acceleration (c) and peak angular acceleration (d), and coup pressure duration to peak linear acceleration (e) and peak angular acceleration (f).
FIGURE 12
FIGURE 12
Linear regression analyses comparing peak average maximum principal and shear strain to: Linear acceleration (a), angular acceleration (b), peak coup pressure (c), and peak rate of coup pressure change (d).
FIGURE 13
FIGURE 13
Comparison of kinematics trends for tests C064-T2 (a) and C380-T1 (b). Parameters compared are linear acceleration, angular speed, C2 relative displacement, and average maximum strain parameters.
FIGURE 14
FIGURE 14
Comparison of brain displacement trends for tests from series C408 and C472 to C383 from Hardy et al. (2001). Superficial target locations (a) and deeper brain target locations (b).
FIGURE 15
FIGURE 15
Comparison of intracranial pressure responses: Test C241-T5 without a helmet to test C241-T1 with a helmet (a), test C241-T5 to Nahum #48 (b), test C241-T5 to Stalnaker 76A145 coup and Trosseille MS429-1 contrecoup (c), and test C241-T1 to Nahum #37 (d).
FIGURE 16
FIGURE 16
Comparison of means with and without helmet use for some significant response parameters.
FIGURE A1
FIGURE A1
Brain motion patterns for two NDT clusters for helmeted test C288-T2 for an offset occipital impact.
FIGURE A2
FIGURE A2
The head responses from test C288-T2 (offset occipital impact with a helmet): Linear acceleration components (upper left), angular acceleration components (upper right), angular speed components (lower left), and pressure responses (lower right).
FIGURE A3
FIGURE A3
The brain responses from test C288-T2 (offset occipital impact with a helmet): Typical relative displacement time histories referred to starting positions (left), and average maximum principal and shear strain time histories (right).
FIGURE A4
FIGURE A4
Brain motion patterns for two NDT clusters for test C288-T3 for an offset occipital impact without a helmet.
FIGURE A5
FIGURE A5
The head responses from test C288-T3 (offset occipital impact without a helmet): Linear acceleration components (upper left), angular acceleration components (upper right), angular speed components (lower left), and pressure responses (lower right).
FIGURE A6
FIGURE A6
The brain responses from test C288-T3 (offset occipital impact without a helmet): Typical relative displacement time histories referred to starting positions (left), and average maximum principal and shear strain time histories (right).
FIGURE A7
FIGURE A7
Brain motion patterns for two NDT clusters for test C288-T4 for an aligned occipital impact without a helmet.
FIGURE A8
FIGURE A8
The intracranial pressure response from test C288-T4 (aligned occipital impact without a helmet).
FIGURE A9
FIGURE A9
The brain responses from test C288-T4 (aligned occipital impact without a helmet): Typical relative displacement time histories referred to starting positions (left), and average maximum principal and shear strain time histories (right).
FIGURE A10
FIGURE A10
The head responses from test C241-T1 (aligned occipital impact with a helmet) and test C241-T2 (aligned occipital impact with a helmet): Linear acceleration components (top), angular acceleration components (middle), and pressure responses (bottom).
FIGURE A11
FIGURE A11
The head responses from test C241-T3 (offset occipital impact with a helmet) and test C241-T4 (offset occipital impact with a helmet): Linear acceleration components (top), angular acceleration components (middle), and pressure responses (bottom).
FIGURE A12
FIGURE A12
The head responses from test C241-T5 (offest occipital impact without a helmet) and test C241-T6 (aligned occipital impact without a helmet): Linear acceleration components (top), angular acceleration components (middle), and pressure responses (bottom).
FIGURE A13
FIGURE A13
Brain motion patterns for two NDT clusters for helmeted test C064-T2 for an offset occipital impact.
FIGURE A14
FIGURE A14
The head responses from test C064-T2 (offset occipital impact with a helmet): Linear acceleration components (upper left), angular acceleration components (upper right), angular speed components (lower left), and pressure responses (lower right).
FIGURE A15
FIGURE A15
The brain responses from test C064-T2 (offset occipital impact with a helmet): Typical relative displacement time histories referred to starting positions (left), and average maximum principal and shear strain time histories (right).
FIGURE A16
FIGURE A16
Brain motion patterns for two NDT clusters for helmeted test C380-T1 for an offset left temporal impact.
FIGURE A17
FIGURE A17
The head responses from test C380-T1 (offset temporal impact with a helmet): Linear acceleration components (upper left), angular acceleration components (upper right), angular speed components (lower left), and pressure responses (lower right).
FIGURE A18
FIGURE A18
The brain responses from test C380-T1 (offset temporal impact with a helmet): Typical relative displacement time histories referred to starting positions (left), and average maximum principal and shear strain time histories (right).
FIGURE A19
FIGURE A19
Brain motion patterns for two NDT clusters for helmeted test C380-T2 for an offset left parietal impact.
FIGURE A20
FIGURE A20
The head responses from test C380-T2 (offset parietal impact with a helmet): Linear acceleration components (upper left), angular acceleration components (upper right), angular speed components (lower left), and pressure responses (lower right).
FIGURE A21
FIGURE A21
The brain responses from test C380-T2 (offset parietal impact with a helmet): Typical relative displacement time histories referred to starting positions (left), and average maximum principal and shear strain time histories (right).
FIGURE A22
FIGURE A22
Brain motion patterns for two NDT clusters for helmeted test C380-T3 for an aligned left temporal impact.
FIGURE A23
FIGURE A23
The head responses from test C380-T3 (aligned temporal impact with a helmet): Linear acceleration components (upper left), angular acceleration components (upper right), angular speed components (lower left), and pressure responses (lower right).
FIGURE A24
FIGURE A24
The brain responses from test C380-T3 (aligned temporal impact with a helmet): Typical relative displacement time histories referred to starting positions (left), and average maximum principal and shear strain time histories (right).
FIGURE A25
FIGURE A25
Brain motion patterns for two NDT clusters for test C380-T4 for an offset left temporal impact without a helmet.
FIGURE A26
FIGURE A26
The head responses from test C380-T4 (offset temporal impact without a helmet): Linear acceleration components (upper left), angular acceleration components (upper right), angular speed components (lower left), and pressure responses (lower right).
FIGURE A27
FIGURE A27
The brain responses from test C380-T4 (offset temporal impact without a helmet): Typical relative displacement time histories referred to starting positions (left), and average maximum principal and shear strain time histories (right).
FIGURE A28
FIGURE A28
Brain motion patterns for two NDT clusters for test C380-T5 for an offset left parietal impact without a helmet.
FIGURE A29
FIGURE A29
The head responses from test C380-T5 (offset parietal impact without a helmet): Linear acceleration components (upper left), angular acceleration components (upper right), angular speed components (lower left), and pressure responses (lower right).
FIGURE A30
FIGURE A30
The brain responses from test C380-T5 (offset parietal impact without a helmet): Typical relative displacement time histories referred to starting positions (left), and average maximum principal and shear strain time histories (right).
FIGURE A31
FIGURE A31
Brain motion patterns for two NDT clusters for test C380-T6 for an aligned left temporal impact without a helmet.
FIGURE A32
FIGURE A32
The head responses from test C380-T6 (aligned temporal impact without a helmet): Linear acceleration components (upper left), angular acceleration components (upper right), angular speed components (lower left), and pressure responses (lower right).
FIGURE A33
FIGURE A33
The brain responses from test C380-T6 (aligned temporal impact without a helmet): Typical relative displacement time histories referred to starting positions (left), and average maximum principal and shear strain time histories (right).
FIGURE A34
FIGURE A34
Brain motion patterns for two NDT clusters for test C393-T4 for an offset left temporal impact without a helmet.
FIGURE A35
FIGURE A35
The head responses from test C393-T4 (offset temporal impact without a helmet): Linear acceleration components (upper left), angular acceleration components (upper right), angular speed components (lower left), and pressure responses (lower right).
FIGURE A36
FIGURE A36
The brain responses from test C393-T4 (offset temporal impact without a helmet): Typical relative displacement time histories referred to starting positions (left), and average maximum principal and shear strain time histories (right).
FIGURE A37
FIGURE A37
Brain motion patterns for two NDT clusters for test C408-T4 for an offset occipital impact without a helmet.
FIGURE A38
FIGURE A38
The head responses from test C408-T4 (offset occipital impact without a helmet): Linear acceleration components (upper left), angular acceleration components (upper right), angular speed components (lower left), and pressure responses (lower right).
FIGURE A39
FIGURE A39
The brain responses from test C408-T4 (offset occipital impact without a helmet): Typical relative displacement time histories referred to starting positions (left), and average maximum principal and shear strain time histories (right).
FIGURE A40
FIGURE A40
Brain motion patterns for two NDT clusters for test C472-T3 for an offset occipital impact without a helmet.
FIGURE A41
FIGURE A41
The brain responses from test C472-T3 (offset occipital impact without a helmet): Typical relative displacement time histories referred to starting positions (left), and average maximum principal and shear strain time histories (right).
FIGURE D1
FIGURE D1
Inferior view of axial brain slices from the right hemisphere of C472 showing the NDT locations (white arrows).
FIGURE E1
FIGURE E1
Comparison of CFC 180 Hz and 1 kHz linear acceleration data in the direction of impact and CFC 1 kHz intracranial coup pressure for example oscillatory responses from the C241 test series (left), and comparison of CFC 180 Hz and 1 kHz angular acceleration data in the plane of impact for the same tests (right).

References

    1. Al-Bsharat AS, Hardy WN, Yang KH, Khalil TB, King AI, Tashman S. Proc. 43rd Stapp Car Crash Conference. Society of Automotive Engineers; Warrendale PA: 1999. Brain/skull relative displacement magnitude due to blunt head impact: New experimental data and model; pp. 321–332.
    1. Bain AC, Meaney DF. Tissue-level thresholds for axonal damage in an experimental model of central nervous system white matter injury. Journal of Biomechanical Engineering. 2000;122:615–622. - PubMed
    1. Bayly PV, Cohen TS, Leister EP, Ajo D, Leuthardt EC, Genin GM. Deformation of the human brain induced by mild acceleration. Journal of Neurotrauma. 2005;22(8):845–856. - PMC - PubMed
    1. Cater HL, Sundstrom LE, Morrison B. Temporal development of hippocampal cell death is dependent on tissue strain but not strain rate. Journal of Biomechanics. 2006;39(15):2810–2818. - PubMed
    1. Centers for Disease Control and Prevention. Surveillance for traumatic brain injury deaths --- United States, 1989-1998. Morbidity and Mortality Weekly Report. 2002;51(SS10):1–16. - PubMed

Publication types

LinkOut - more resources