. 2008;9(2):R33.
doi: 10.1186/gb-2008-9-2-r33. Epub 2008 Feb 15.

Functional protein divergence in the evolution of Homo sapiens

Affiliations

Functional protein divergence in the evolution of Homo sapiens

Nuria Lopez-Bigas et al. Genome Biol. 2008.

Abstract

Background: Protein-coding regions in a genome evolve by sequence divergence and gene gain and loss, altering the gene content of the organism. However, it is not well understood how this has given rise to the enormous diversity of metazoa present today.

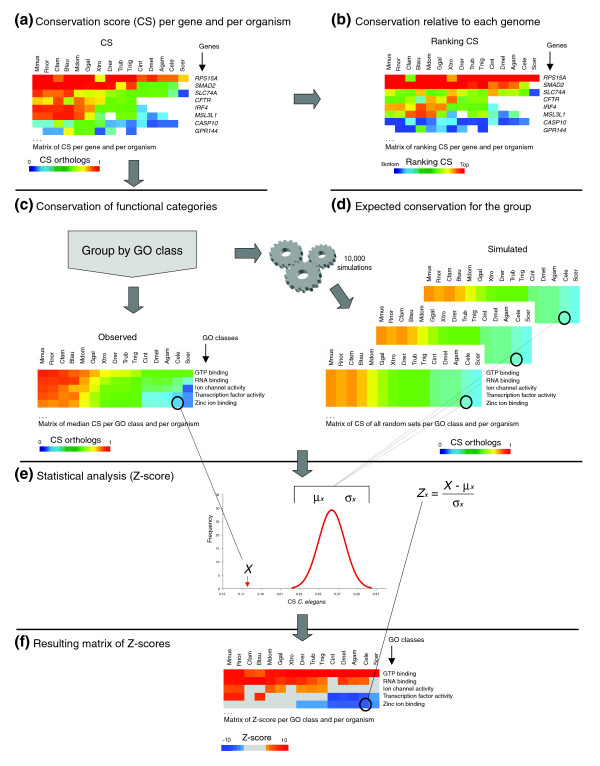
Results: To obtain a global view of human genomic evolution, we quantify the divergence of proteins by functional category at different evolutionary distances from human.

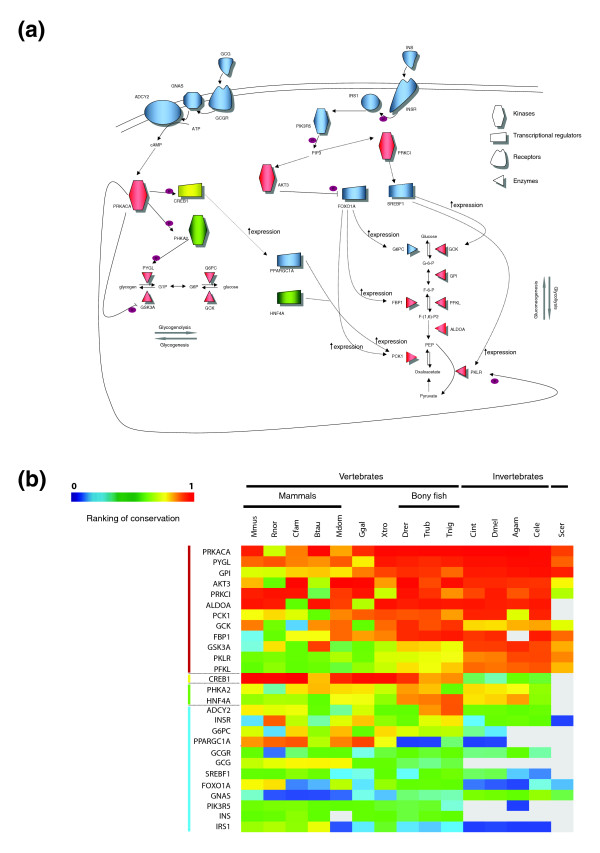
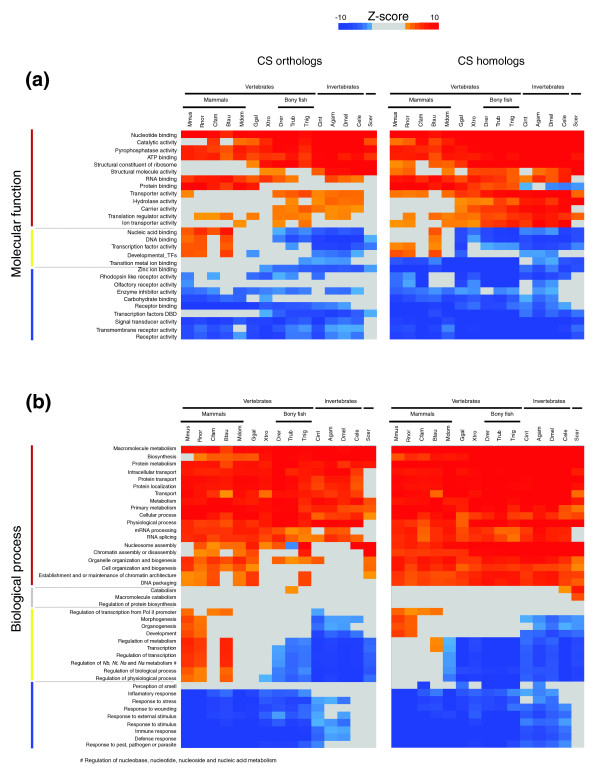
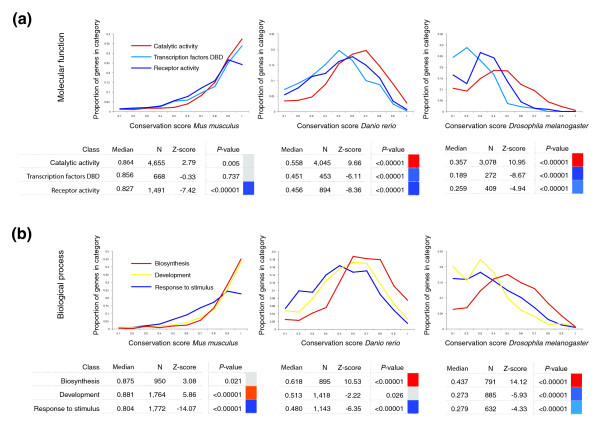
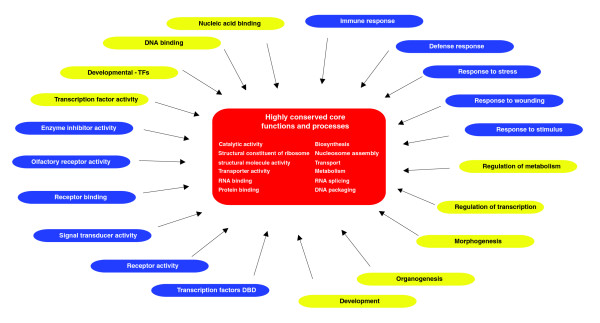
Conclusion: This analysis highlights some general systems-level characteristics of human evolution: regulatory processes, such as signal transducers, transcription factors and receptors, have a high degree of plasticity, while core processes, such as metabolism, transport and protein synthesis, are largely conserved. Additionally, this study reveals a dynamic picture of selective forces at short, medium and long evolutionary timescales. Certain functional categories, such as 'development' and 'organogenesis', exhibit temporal patterns of sequence divergence in eukaryotes relative to human. This framework for a grammar of human evolution supports previously postulated theories of robustness and evolvability.


Figures

Figure 1
Figure 1
Flow chart of the FRED method for analyzing the protein divergence landscape of functional categories. (a) We start from a matrix of all human genes with the conservation score (CS) in each of the 15 genomes analyzed. (b) First, all genes with a CS over 0 are ranked in each organism, and the highly ranked genes are shown in red and lowly ranked in blue following a gradient of colors. White cells mean that no ortholog/homolog is detected. Next, the genes are classified according to GO terms. (c) For each set of genes within a GO category, we calculate the median CS, and also select 10,000 sets of the same number of genes as in the GO category considered at random from the complete set of genes with GO annotation. (d) For each random set, we calculate the median CS. (e) From the 10,000 random sets we obtain the expected median CS and the standard error, which allow us to calculate the Z-score for the GO category under consideration. (f) This Z-score is then plotted in a matrix on a color-coded scale. Gray means no significant difference in the level of conservation compared to the background. A similar procedure is followed for the calculation of Z-scores for number of orthologs and homologs by counting the proportion of genes with homologs or orthologs in each set. Mmus, Mus musculus; Rnor, Rattus norvegicus; Cfam, Canis familiaris; Bta, Bos taurus; Mdom, Monodelphis domestica; Ggal, Gallus gallus; Xtro, Xenopus tropicalis; Drer, Danio rerio; Trub, Takifugu rubripes; Tnig, Tetraodon nigroviridis; Cint, Ciona intestinalis; Agam, Anopheles gambiae; Dmel, Drosophila melanogaster; Cele, Caenorhabditis elegans; Scer, Saccharomyces cerevisiae. All the results of these analyses for all GO categories are provided online in a searchable database at [28].
Figure 2
Figure 2
Degree of conservation of the glucagon and insulin signaling pathways. (a) Regulatory interactions between proteins involved in glucagon (GCG) and insulin (INS) signaling, and enzymes involved in glucose and glycogen metabolism. Proteins depicted in red show high conservation, those depicted blue have low levels of conservation and the ones in green intermediate conservation. The CREB protein is represented in yellow because it is highly conserved in vertebrates and not in invertebrates. There is a clear correlation between the functions of the molecules shown in the key and the degree of conservation indicated by the color code: enzymes and kinases tend to be red and conserved, while signal transducers, receptors and transcription factors tend to be blue and divergent. (b) Matrix of normalized ranking of the genes depicted in (a). The rows in the matrix are ordered by the sum of the CS rank in the 15 organisms.
Figure 3
Figure 3
Divergence of orthologs and homologs of representative functional categories. (a) Molecular function and (b) biological process. Colors towards red signify high relative conservation of the group of genes in a particular genome. Colors towards blue signify low relative conservation. Gray means no statistically significant difference in conservation level compared to the background of the rest of the genome. White cells denote that there is no gene with the GO term and with ortholog/homolog in the other organism. The colored lines on the left of the names of the functional classes correspond to the colors of the categories represented in Figure 5.
Figure 4
Figure 4
Histogram distribution of CSs of orthologs for selected GO categories in M. musculus, D. rerio and D. melanogaster. (a) The CS distributions for proteins in three molecular function categories. 'Catalytic activity' is significantly conserved in all three organisms, while 'Transcription factors DBD' and 'Receptor activity' are significantly divergent in zebrafish and Drosophila. (b) The CS distributions for proteins in three biological process categories. 'Biosynthesis' is a highly conserved category in all three organisms, while 'Development' is significantly conserved in mouse but significantly divergent in Drosophila. 'Response to stimulus' is significantly divergent across all three organisms.
Figure 5
Figure 5
Peripheral and core functional categories. A set of core molecular functions and biological processes that are highly conserved are represented in red in the centre of the figure. Other sets of functions and processes that are highly divergent across all eukaryotes (blue) or highly divergent in some organisms and highly conserved in others (yellow) are represented on the periphery as regulators of the core processes. The colors correspond to the colored lines on the left in Figure 3.

References

    1. Dickerson RE. The structures of cytochrome c and the rates of molecular evolution. J Mol Evol. 1971;1:26–45. doi: 10.1007/BF01659392. - DOI - PubMed
    1. Dayhoff M, Schwartz R, Orcutt B. A model of evolutionary change in proteins. In: Dayhoff M, editor. Atlas of Protein Sequence and Structure. Vol. 5. Silver Springs, MD: National Biomedical Research Foundation; 1978. pp. 345–352.
    1. Hillier LW, Miller W, Birney E, Warren W, Hardison RC, Ponting CP, Bork P, Burt DW, Groenen MA, Delany ME, Dodgson JB, Chinwalla AT, Cliften PF, Clifton SW, Delehaunty KD, Fronick C, Fulton RS, Graves TA, Kremitzki C, Layman D, Magrini V, McPherson JD, Miner TL, Minx P, Nash WE, Nhan MN, Nelson JO, Oddy LG, Pohl CS, Randall-Maher J, et al. Sequence and comparative analysis of the chicken genome provide unique perspectives on vertebrate evolution. Nature. 2004;432:695–716. doi: 10.1038/nature03154. - DOI - PubMed
    1. Albà MM, Castresana J. Inverse relationship between evolutionary rate and age of mammalian genes. Mol Biol Evol. 2005;22:598–606. doi: 10.1093/molbev/msi045. - DOI - PubMed
    1. Luz H, Vingron M. Family specific rates of protein evolution. Bioinformatics. 2006;22:1166–1171. doi: 10.1093/bioinformatics/btl073. - DOI - PubMed

Publication types

LinkOut - more resources