Comparative Study
. 2008 Apr 1;75(7):1550-60.
doi: 10.1016/j.bcp.2007.12.012. Epub 2008 Jan 5.

Mouse N-acetyltransferase type 2, the homologue of human N-acetyltransferase type 1

Affiliations
Comparative Study

Mouse N-acetyltransferase type 2, the homologue of human N-acetyltransferase type 1

Akane Kawamura et al. Biochem Pharmacol. .

Abstract

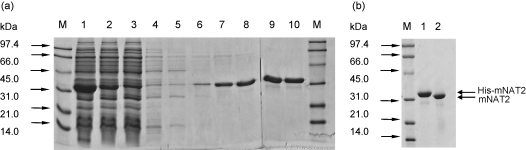
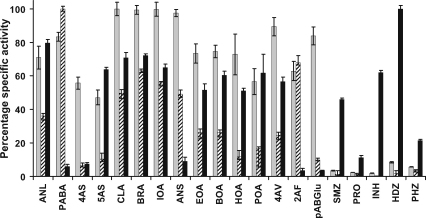
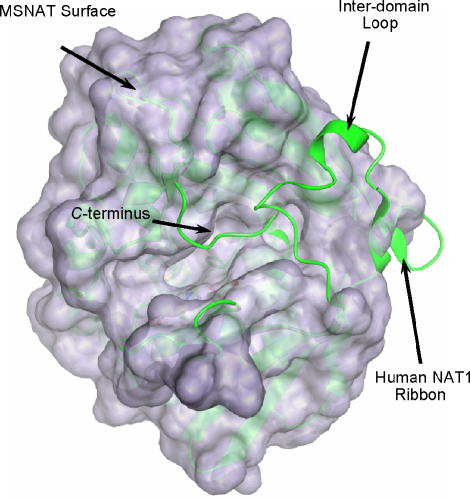
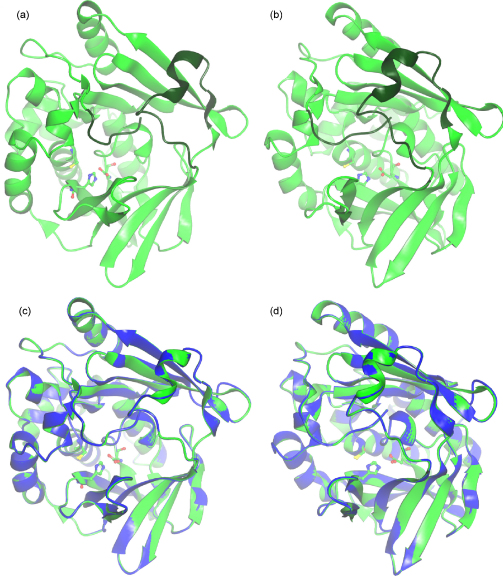
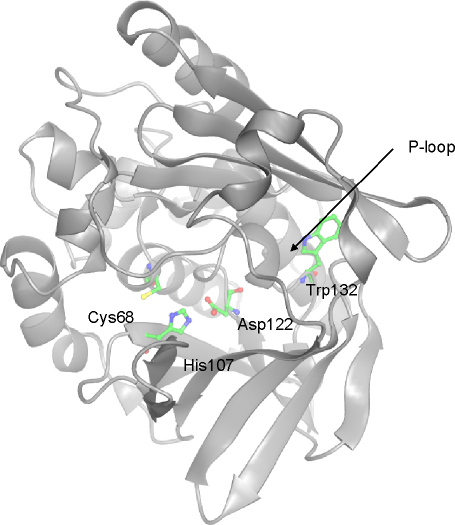
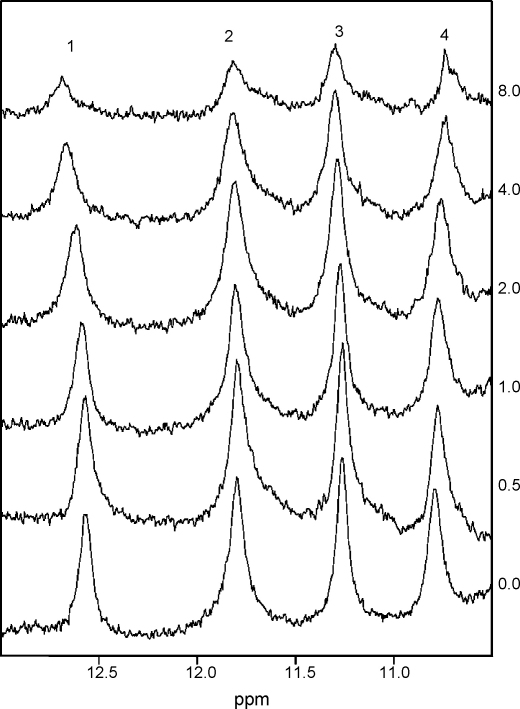
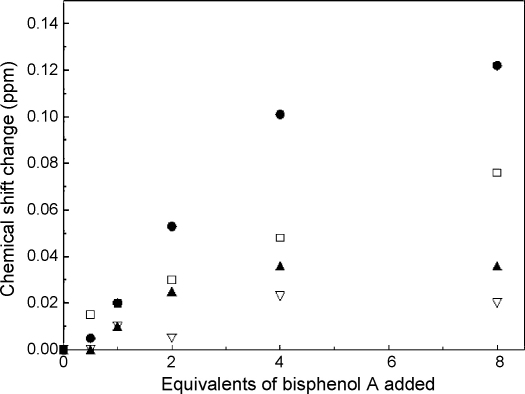
There is increasing evidence that human arylamine N-acetyltransferase type 1 (NAT1, EC 2.3.1.5), although first identified as a homologue of a drug-metabolising enzyme, appears to be a marker in human oestrogen receptor positive breast cancer. Mouse Nat2 is the mouse equivalent of human NAT1. The development of mouse models of breast cancer is important, and it is essential to explore the biological role of mouse Nat2. We have therefore produced mouse Nat2 as a recombinant protein and have investigated its substrate specificity profile in comparison with human NAT1. In addition, we have tested the effects of inhibitors on mouse Nat2, including compounds which are endogenous and exogenous steroids. We show that tamoxifen, genistein and diethylstilbestrol inhibit mouse Nat2. The steroid analogue, bisphenol A, also inhibits mouse Nat2 enzymic activity and is shown by NMR spectroscopy, through shifts in proton peaks, to bind close to the active site. A three-dimensional structure for human NAT1 has recently been released, and we have used this crystal structure to generate a model of the mouse Nat2 structure. We propose that a conformational change in the structure is required in order for ligands to bind to the active site of the protein.


Figures

Fig. 1
Fig. 1
Heterologous expression and purification of recombinant mouse Nat2 in E. coli. SDS-PAGE analysis of expression and affinity purification of mouse Nat2. Mouse Nat2 was produced in E. coli Rosetta(DE3)pLysS strain and purified by Ni-NTA affinity chromatography. The purification gel shows expression of His-Nat2 at 34 kDa. Lanes: 1, whole cells; 2, soluble fraction; 3, unbound wash; 4, 0 mM imidazole (IMZ) wash; 5, 1 mM IMZ wash; 6, 10 mM IMZ wash; 7, 20 mM IMZ wash; 8, 50 mM IMZ wash; 9, first 100 mM IMZ wash; 10, second 100 mM IMZ wash; M, low-range molecular weight markers (BioRad). Thrombin cleavage of His-Nat2. Purified His-Nat2 was incubated with thrombin (5 U/mg NAT) at 4 °C for 6 h for complete His-tag cleavage. Lanes: M, low-range molecular weight marker (BioRad); 1, His-Nat2 only (8 μg); 2, thrombin-treated, Nat2 (8 μg).
Fig. 2
Fig. 2
Comparison of the substrate specific activity profiles of mouse Nat2, human NAT1 and human NAT2. The substrate specific activity profiles for mouse Nat2 (grey bars), human NAT1 (cross-hatched bars) and human NAT2 (black bars) are shown. The activity of mouse Nat2 was determined by measuring the rate of CoA production, as described in Section 2. Purified mouse Nat2 (0.125 μg) was incubated with arylamine substrate (each at 500 μM) and AcCoA (400 μM) in assay buffer (20 mM Tris–HCl (pH 8.0)) containing 0.5% (v/v) DMSO at 25 °C. The specific activities were determined from the linear initial rates of reaction. All measurements were performed in triplicate and are expressed as mean ± standard deviation relative to the most rapidly acetylated substrate. The human NAT1 and NAT2 data are taken from . The abbreviations are defined in Section 2.
Fig. 3
Fig. 3
Comparison of the crystal structures of NAT from M. smegmatis (MSNAT) and human NAT1. The surface shown was calculated from the MSNAT crystal structure (PDB accession code 1GX3), and the human NAT1 crystal structure F125S mutant (PDB accession code 2IJA) is shown in ribbon format. The C-terminus and inter-domain loop region of human NAT1 protrude from the eukaryotic protein core, and both of these protein regions block the prokaryotic NAT active site. The C-terminus of human NAT1 is found in the region termed the ‘β-site’ .
Fig. 4
Fig. 4
(a) and (b) The structure of mouse Nat2. The mouse Nat2 protein structure was produced by homology modelling with the program Modeller 8v2 . The human NAT1 crystal structure (PDB code 2IJA) was used as a template, and the amino acid sequences of human NAT1 and mouse Nat2 were aligned with the program ClustalW . The mouse Nat2 ribbon structure is shown in green. The ribbon structures of the inter-domain loop region and C-terminal hexapeptide residues (residues 168–184 and 285–290) are shown in dark green, and the active site catalytic triad (Cys68, His107 and Asp122) residues are shown in ball and stick representation. The pdb file of the mouse Nat2 homology model is available upon request. The figure was produced with Aesop, as previously described . (c) and (d) A comparison of the human NAT1 crystal structure (PDB code 2IJA) and the mouse Nat2 homology model. The human NAT1 crystal structure is shown in blue and the mouse Nat2 model is shown in green. The two proteins share 82% identity at the amino acid level. Over 1191 equivalent atoms, the two structures have a root mean squared deviation of 0.75 Å. The catalytic triad residues for both proteins are shown in ball and stick representation. The views in (b) and (d) were obtained by rotating the structures shown in (a) and (c) by 30°. (For interpretation of the references to colour in this figure legend, the reader is referred to the web version of the article.)
Fig. 5
Fig. 5
750 MHz 2D 1H-15N HSQC spectrum of mouse Nat2.
Fig. 6
Fig. 6
The downfield region of the 1D 1H NMR spectra of (A) mouse and (B) hamster Nat2 collected using a jump-return pulse sequence. These peaks arise from the indole HN of two tryptophan residues (peaks 2 and 3, Trp67 and Trp132 respectively) and from imidazole HN of histidine (peaks 1 and 4, His).
Fig. 7
Fig. 7
The mouse Nat2 homology model, based on the crystal structure of human NAT1, showing the position of Trp132 relative to the active-site triad (shown in ball and stick representation). The putative phosphate-binding P-loop is shown.
Fig. 8
Fig. 8
The downfield region of the 1D 1H NMR spectra obtained in a titration of mouse Nat2 with bisphenol A. Spectra collected with 0–8 equivalents of bisphenol A are shown. Peaks are observed to shift and to broaden as increasing amounts of bisphenol A are added; this broadening may indicate chemical exchange within the bound protein. Some precipitation of protein was observed with 8 equivalents of bisphenol A, which is likely to account for the decrease in peak intensity in this spectrum.
Fig. 9
Fig. 9
Titration of mouse Nat2 with bisphenol A. The magnitudes of changes in chemical shift observed for the four downfield shifted peaks are shown as a function of the amount of added bisphenol A. The largest shifts are observed for peaks 1 (filled circle) and 4 (open square) which arise from histidine; smaller shifts are observed for peaks 2 (open triangle) and 3 (filled triangle).

Similar articles

Cited by

References

    1. Sim E., Westwood I., Fullam E. Arylamine N-acetyltransferases. Expert Opin. Drug Metab. Toxicol. 2007;3:169–184. - PubMed
    1. Kawamura A., Graham J., Mushtaq A., Tsiftsoglou S.A., Vath G.M., Hanna P.E. Eukaryotic arylamine N-acetyltransferase Investigation of substrate specificity by high-throughput screening. Biochem. Pharmacol. 2005;69:347–359. - PubMed
    1. Gruvberger S., Ringner M., Chen Y., Panavally S., Saal L.H., Borg A. Estrogen receptor status in breast cancer is associated with remarkably distinct gene expression patterns. Cancer Res. 2001;61:5979–5984. - PubMed
    1. Hess K.R., Anderson K., Symmans W.F., Valero V., Ibrahim N., Mejia J.A. Pharmacogenomic predictor of sensitivity to preoperative chemotherapy with paclitaxel and fluorouracil, doxorubicin, and cyclophosphamide in breast cancer. J. Clin. Oncol. 2006;24:4236–4244. - PubMed
    1. Miller L.D., Smeds J., George J., Vega V.B., Vergara L., Ploner A. An expression signature for p53 status in human breast cancer predicts mutation status, transcriptional effects, and patient survival. Proc. Natl. Acad. Sci. U.S.A. 2005;102:13550–13555. - PMC - PubMed

Publication types