. 2008 Aug;22(6):912-22.
doi: 10.1016/j.bbi.2008.01.002. Epub 2008 Feb 15.

Ecstasy (3,4-methylenedioxymethamphetamine) limits murine gammaherpesvirus-68 induced monokine expression

Affiliations

Ecstasy (3,4-methylenedioxymethamphetamine) limits murine gammaherpesvirus-68 induced monokine expression

Daniel A Nelson et al. Brain Behav Immun. 2008 Aug.

Abstract

While Ecstasy (3,4-methylenedioxymethamphetamine, MDMA) has been shown to modulate immune responses, no studies have addressed drug-induced alterations to viral infection. In this study, bone marrow-derived macrophages were exposed to MDMA, then infected with murine gammaherpesvirus-68, and the expression of monokines assessed. MDMA-induced reductions in virus-stimulated monokine mRNA expression were observed in a dose-dependent manner. In particular, IL-6 mRNA expression and secretion was significantly decreased in gammaherpesvirus-infected macrophages exposed to MDMA. Concentrations of MDMA capable of reducing monokine production did not induce significant cell death and allowed normal viral gene expression. These studies represent the first to demonstrate the ability of this drug of abuse to alter a viral-induced macrophage response.


Figures

Figure 1
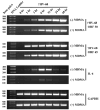
Figure 1. MDMA time course and dose-response assessed by semiquantitative PCR of IL-6 mRNA induction in mouse macrophages after γHV-68 infection
Panel A - Macrophages were untreated or pretreated with 500 μM MDMA for 24 hrs followed by the addition of γHV-68 for the times indicated in the figure. cDNA was then prepared from total RNA and PCR performed. Expression of the housekeeping gene, GAPDH, is shown as a positive control to indicate that similar amounts of cDNA are present in each sample. While GAPDH expression is unaffected, IL-6 mRNA induction is greatly reduced by the presence of MDMA. The results are presented as amplified products electrophoresed on ethidium bromide stained agarose gels. DNA sizes in base pairs are shown to the left of the DNA standard. Panel B - Mouse macrophages were incubated for 24 hr with various concentrations of MDMA and the incubation in Ecstasy continued for another 6 hr after the addition of γHV-68 (1:1). Total RNA was isolated, cDNA prepared and PCR results shown for GAPDH and IL-6 expression.
Figure 2
Figure 2. Cell viability and caspase 3/7 activity in MDMA treated mouse macrophages
Mature macrophages were incubated for 24 hr with MDMA, and then γHV-68 added for an additional 24 hr in the amounts shown in the figure. (Panel A) Macrophages were grown in 96-well plates and viability assayed by quantification of the amount of ATP present in each well, as described in the CellTiter-Glo Luminescent Cell Viability Assay. The number of viable macrophages in culture is directly proportional to the amount of ATP. Luminescence from a well with 1 nM ATP is included to demonstrate that light release from sample wells had not reached a plateau. The horizontal bar shows the mean luminescence from cells without MDMA. The Viability assay was performed four separate times (N = 4) and values are presented as means +/-SEM. Two-way ANOVA using MDMA concentration and γHV-68 titers as sources of variation indicate that MDMA has a major effect on cell viability (F = 124.2). For the virus to macrophage ratio of 1:1, wells with luminescence statistically significantly below the horizontal bar (p<0.001) are marked by an (*), indicating reduced macrophage viability. (Panel B) Caspase 3 and caspase 7 activity, a proxy for apoptosis, in macrophages assayed by the Caspase-Glo 3/7 Assay. The amount of caspase activity, and therefore the amount of apoptosis, is proportional to the luminescence signal from each well. The horizontal bar shows the mean luminescence from cells without MDMA. The Caspase 3/7 assay was performed four separate times (N = 4) and values are presented as means +/- SEM. Two-way ANOVA using MDMA concentration and γHV-68 titers as sources of variation indicate that MDMA has a major effect on cell apoptosis (F = 31.6). For the virus to macrophage ratio of 1:1, wells with luminescence statistically significantly above the horizontal bar (p<0.05) are marked by an (*), suggesting increased macrophage apoptosis.
Figure 3
Figure 3. Mouse macrophage morphology in the presence of MDMA and γHV-68
Macrophages were stained, fixed, mounted and photographed at 640X magnification, as described in the Materials and Methods. Panel A – Control macrophages. Panel B –Macrophages infected 1:1 with γHV-68 (24 hr). Panel C – Macrophages incubated with 500 μM MDMA (48 hr). Panel D – Macrophages incubated with 500 μM MDMA (48 hr) and γHV-68 (1:1; 24 hr). Cells incubated with MDMA and activated with γHV-68 appeared reduced in length relative to macrophages with MDMA, or γHV-68 alone.
Figure 4
Figure 4. Semiquantitative PCR analysis of IL-6 mRNA induction after γHV-68 infection of mouse macrophages in the presence of 500 μM MDMA or other monoamines
Panel A – A comparison of IL-6 expression in the presence of glycine and the monoamines tyramine and MDMA. Macrophages were pretreated with the various compounds for 24 hr and the cells further incubated for 6 hr in the presence and absence of γHV-68. Relative to glycine or tyramine, IL-6 mRNA induction by γHV-68 is reduced in the presence of 500 μM MDMA. Panel B – Results similar to panel A, showing the specificity of the suppression of IL-6 induction by γHV-68 in the presence of 500 μM MDMA relative to other trace amines.
Figure 5
Figure 5. Relative quantification of mouse macrophage monokine mRNA induction by γHV-68 in the presence or absence of 500 μM MDMA using real time PCR
Expression of monokine mRNA was monitored by real time PCR during a time course of macrophage activation with γHV-68 (1:1; cell: virus) in the presence or absence of MDMA. 500 μM MDMA was added to appropriate cells 24 hr prior to the addition of virus. Data for each graph are from three separate experiments (N = 3), with the cycle threshold (CT) value for each sample from each experiment determined in triplicate. The fold-change (fold induction) is relative to the 0 time control, and was determined for each sample using the equation, fold-change = 2CT(control)-CT (sample). Mean values of the fold-change +/- SEM are then presented in each graph.
Figure 6
Figure 6. Effects of 500 μM MDMA and other monoamines on IL-6 secretion after γHV-68 infection of mouse macrophages
Panel A – Macrophages were incubated for 24 hr in the presence or absence of 500 μM MDMA and then virus added for a further 12 or 24 hr. Panel B – Macrophages were incubated for 24 hr in the presence, or absence of 500 μM monoamines and the incubation continued with, or without virus, for a further 24 hr. For both panels, the amount of IL-6 in the medium was measured by ELISA and the results presented as mean IL-6 concentrations +/- SEM. Each experiment was performed 3 separate times (N = 3), with each value obtained in duplicate. One-way ANOVA, followed by Tukey’s Multiple Comparison Test indicate the two 12 hr time points +/-MDMA, and 24 hr time points +/- MDMA were statistically significantly different at the p<0.001 level (panel A). Similarly, after viral activation, only MDMA significantly reduced IL-6 secretion relative to control macrophages at the p<0.001 level (panel B).
Figure 7
Figure 7. Semiquantitative PCR analysis of γHV-68 mRNA expression in mouse macrophages in the presence and absence of 500 μM MDMA
Macrophages were untreated, or pretreated with MDMA for 24 hrs followed by the addition of γHV-68 for the times indicated in the figure. PCR was then performed for two viral genes, ORF50 and ORF65, expressed early in the infection. Total RNA was treated with DNase prior to cDNA synthesis to remove viral genomic DNA. PCR using the same cDNA samples was also performed for GAPDH as a control for the presence of cDNA, and for IL-6 to illustrate the effect of MDMA on cytokine mRNA induction.
Figure 8
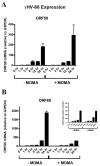
Figure 8. Relative quantification of γHV-68 mRNA expression in mouse macrophages in the presence and absence of 500 μM MDMA using real time PCR
The ORF50 and ORF65 viral gene expression shown in figure 7 was quantified by real time PCR. Cells were pretreated for 24 hr with 500 μM MDMA, followed by the addition of virus for the times indicated. Panel A - Expression of ORF50 mRNA was unaffected by pre-incubation for 24 hr with 500 μM MDMA. The experiment was performed three separate times (N = 3), with the value of each sample determined in duplicate. The fold-change for each time point was determined as described in the legend to figure 5 and normalized to the fold-change in mRNA expression for the housekeeping gene, GAPDH. Mean values +/- SEM are presented. One-way ANOVA followed by Tukey’s multiple comparison test suggests that for each time point, the presence of MDMA did not alter the relative expression of ORF50 mRNA (p>0.05). Panel B – ORF65 showed a lag time of expression when MDMA was present in the medium, as can be seen in the insert. Data was acquired as in panel A, and the mean values of the relative fold-change +/- SEM are presented.

Similar articles

Cited by

References

    1. Battaglia G, Brooks BP, Kulsakdinun C, De Souza EB. Pharmacologic profile of MDMA (3,4-methylenedioxymethamphetamine) at various brain recognition sites. Eur J Pharmacol. 1988;149:159–163. - PubMed
    1. Bowman CC, Bost KL. Cyclooxygenase-2-mediated prostaglandin E2 production in mesenteric lymph nodes and in cultured macrophages and dendritic cells after infection with Salmonella. J Immunol. 2004;172:2469–2475. - PubMed
    1. Boyle NT, Connor TJ. MDMA (“Ecstasy”) suppresses the innate IFN-gamma response in vivo: A critical role for the anti-inflammatory cytokine IL-10. Eur J Pharmacol. 2007;572:228–238. - PubMed
    1. Capela JP, Fernandes E, Remiao F, Bastos ML, Meisel A, Carvalho F. Ecstasy induces apoptosis via 5-HT(2A)-receptor stimulation in cortical neurons. Neurotoxicology. 2007;28:868–875. - PubMed
    1. Capela JP, Ruscher K, Lautenschlager M, Freyer D, Dirnagl U, Gaio AR, Bastos ML, Meisel A, Carvalho F. Ecstasy-induced cell death in cortical neuronal cultures is serotonin 2A-receptor-dependent and potentiated under hyperthermia. Neuroscience. 2006;139:1069–1081. - PubMed

Publication types

MeSH terms