Comparative Study
. 2008 Mar;15(3):300-13.
doi: 10.1016/j.acra.2007.10.012.

Computer-assisted segmentation of white matter lesions in 3D MR images using support vector machine

Affiliations
Comparative Study

Computer-assisted segmentation of white matter lesions in 3D MR images using support vector machine

Zhiqiang Lao et al. Acad Radiol. 2008 Mar.

Abstract

Rationale and objectives: Brain lesions, especially white matter lesions (WMLs), are associated with cardiac and vascular disease, but also with normal aging. Quantitative analysis of WML in large clinical trials is becoming more and more important.

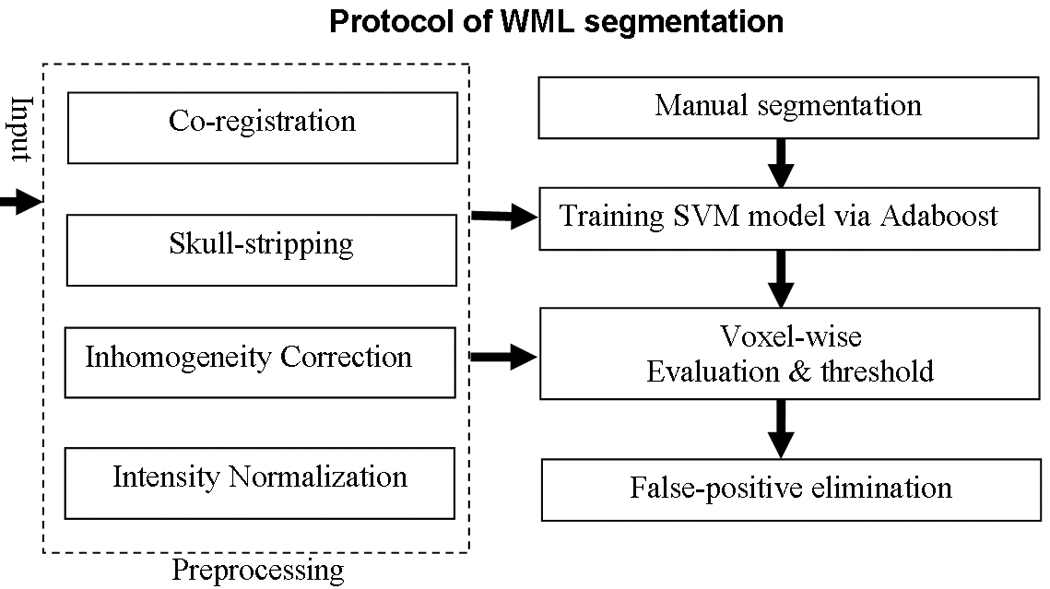
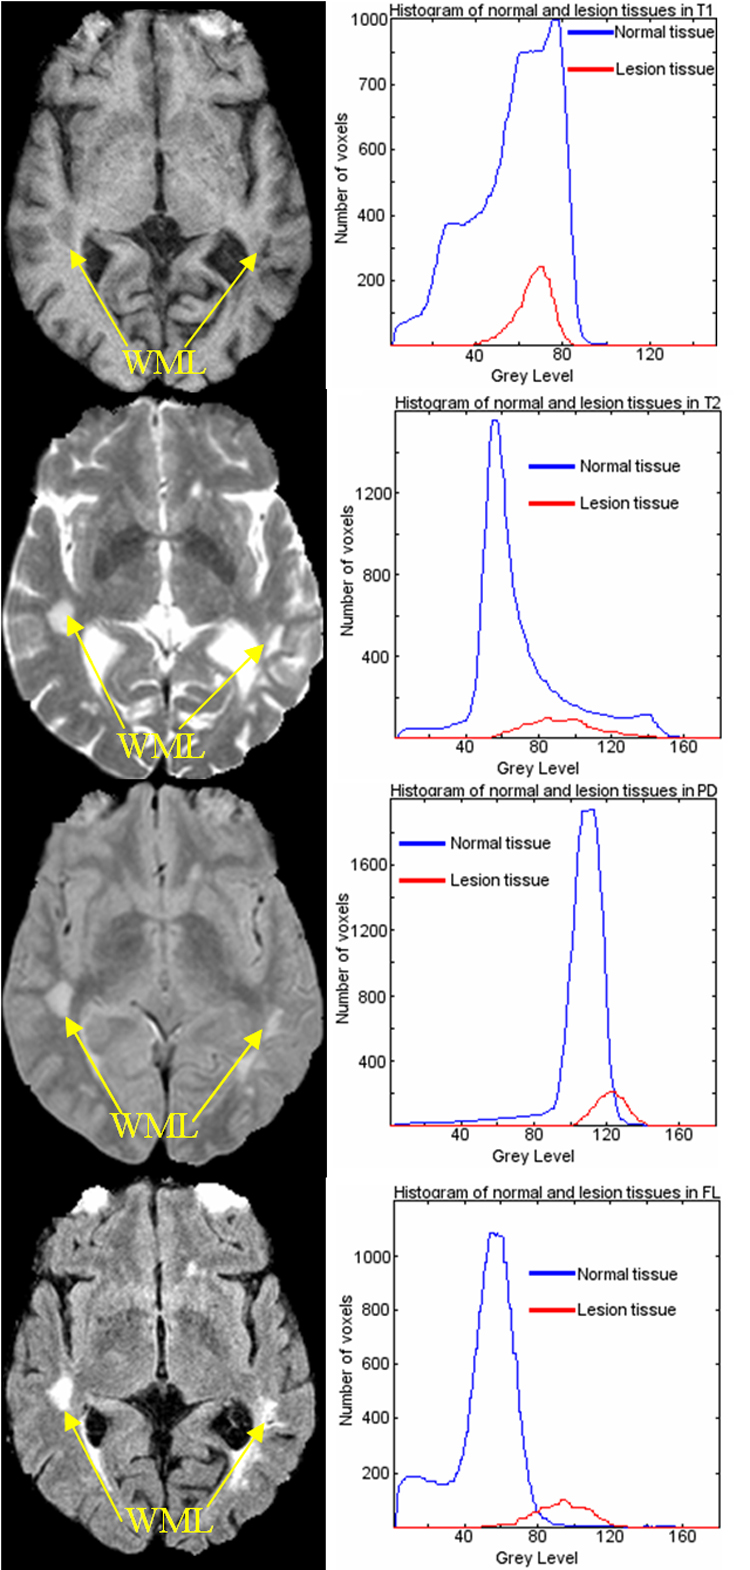
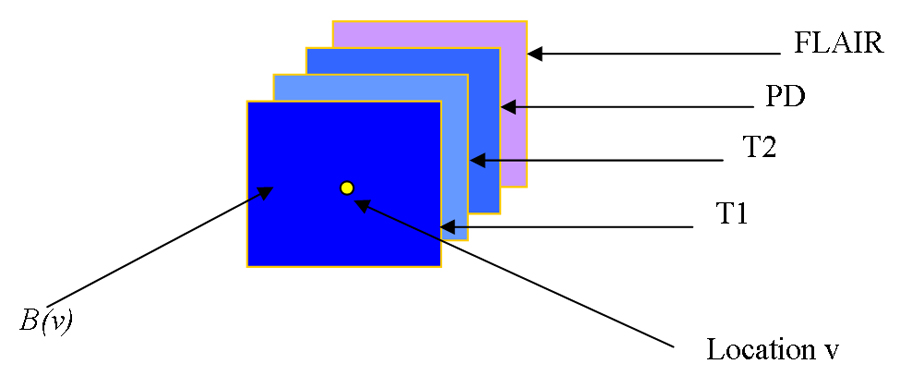
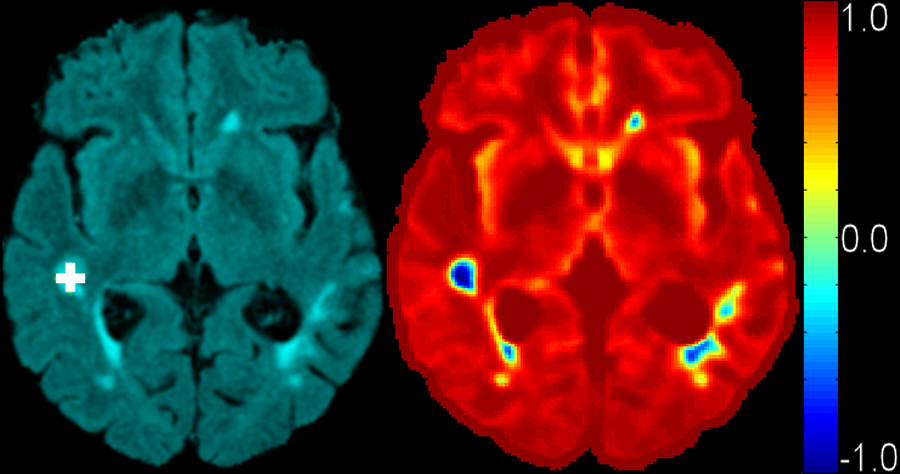
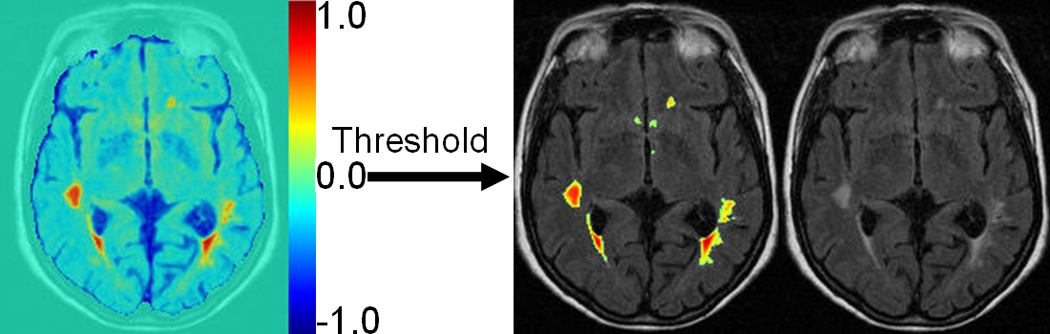
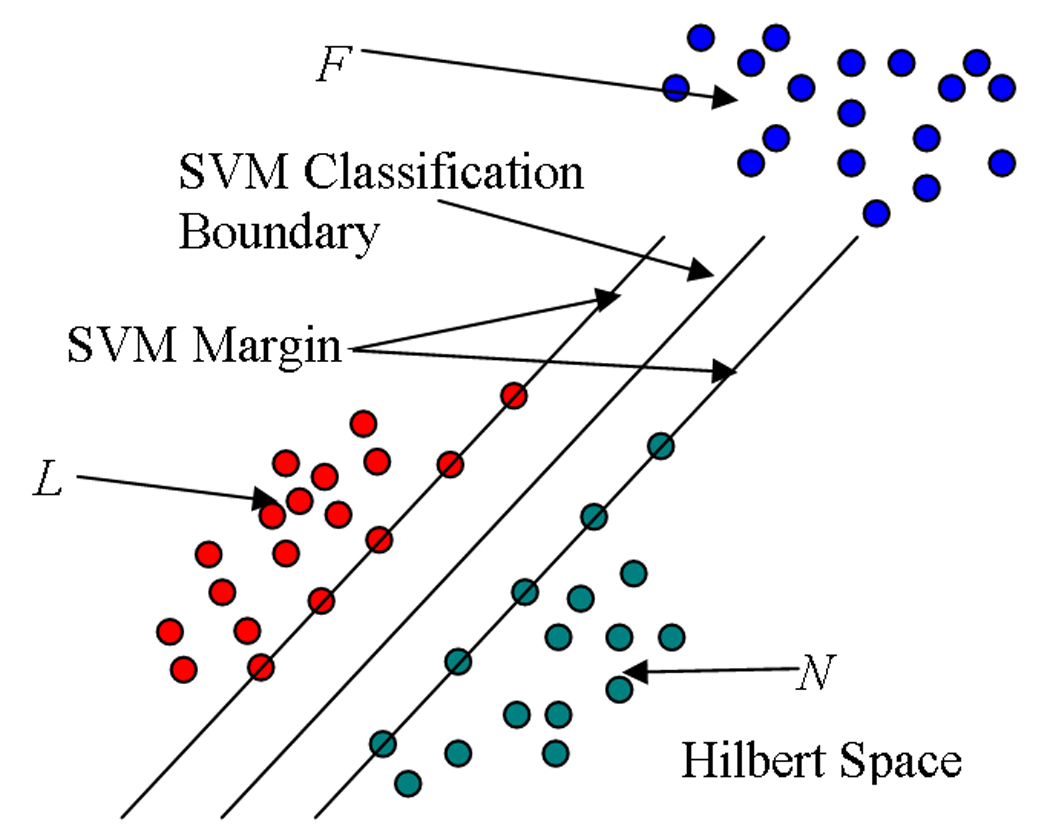
Materials and methods: In this article, we present a computer-assisted WML segmentation method, based on local features extracted from multiparametric magnetic resonance imaging (MRI) sequences (ie, T1-weighted, T2-weighted, proton density-weighted, and fluid attenuation inversion recovery MRI scans). A support vector machine classifier is first trained on expert-defined WMLs, and is then used to classify new scans.

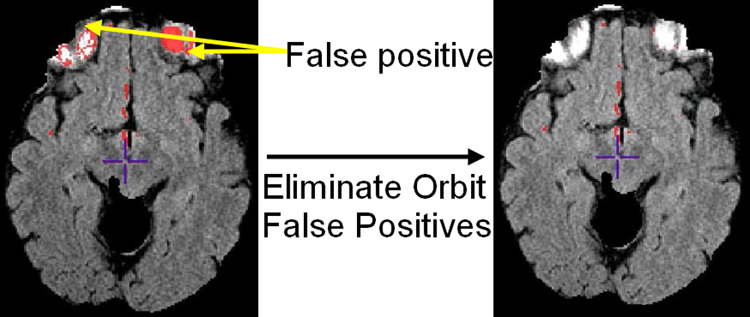
Results: Postprocessing analysis further reduces false positives by using anatomic knowledge and measures of distance from the training set.

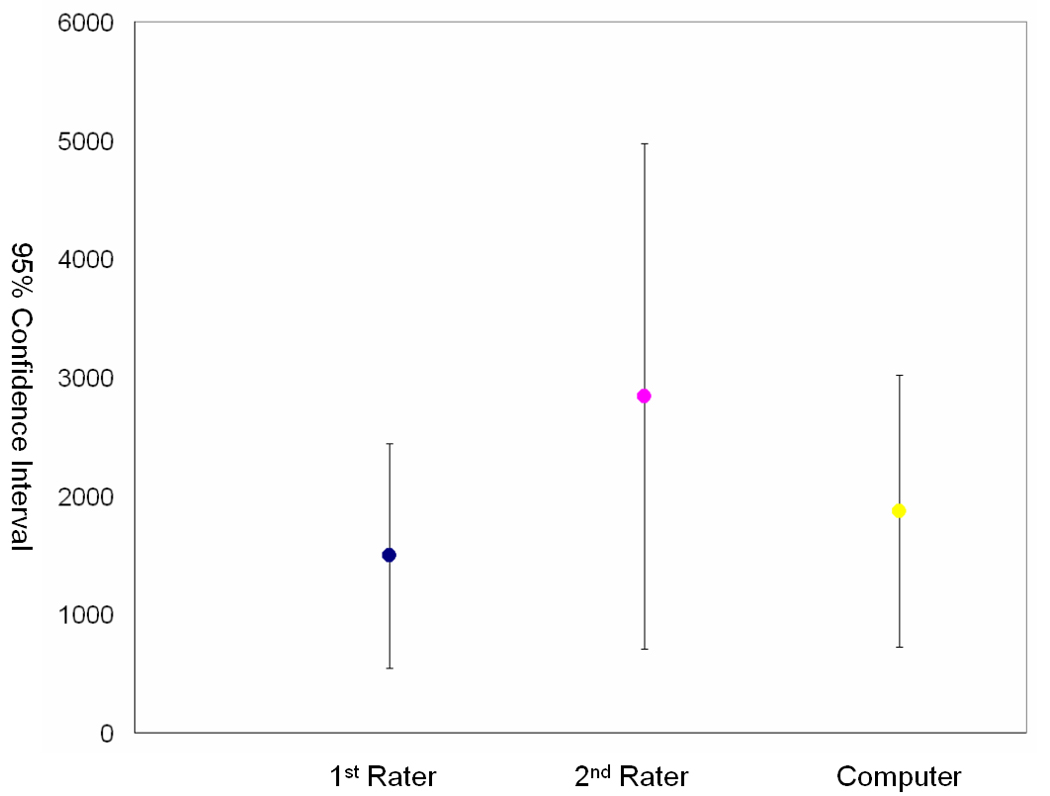
Conclusions: Cross-validation on a population of 35 patients from three different imaging sites with WMLs of varying sizes, shapes, and locations tests the robustness and accuracy of the proposed segmentation method, compared with the manual segmentation results from two experienced neuroradiologists.


Figures

Fig. 1
Fig. 1
Summary of our computer-assisted WMLs segmentation protocol.
Fig. 2
Fig. 2
Intensity overlaps between WMLs tissue and normal tissue in T1, T2, PD and FLAIR, respectively (Histograms for normal tissue have been scaled by 0.1 for visualization purpose).
Fig. 3
Fig. 3
Image intensities from all modalities and all voxels in the spatial neighborhood of a voxel from an AV that serves as an “imaging signature” of each voxel.
Fig. 4
Fig. 4
Discrimination ability of AV. Left: FLAIR image with selected lesion voxel marked as white cross. Right: distance distribution in Hilbert space from all other voxels to this selected voxel. AVs of other lesion voxels are similar (having small distance in the attribute space) to the selected voxel, indicating that this imaging signature is characteristic of lesions.
Fig. 5
Fig. 5
An example of two-class (+ and −) problem showing optimal separating hyperplane (dotted line) that SVM uses to divide two groups’ data, and the associated Support Vectors. Data shown by ‘+’ and ‘−’ represent binary class +1 and −1, respectively.
Fig. 6
Fig. 6
Illustration of voxel-wise segmentation by SVM. Left is the result of voxel-wise evaluation map showing different lesion rating for each voxel, based on generated SVM model (1: lesion; −1: normal). Right is WML segmentation result after thresholding the map on the left superimposed on FLAIR image. Threshold actually corresponds to SVM classification boundary as illustrated in Fig. 7., with 2 classes labeled as −1 and 1 respectively, 0.0 is selected as a threshold.
Fig. 7
Fig. 7
Illustration of L, N and F distribution in Hilbert space. Green and red represent AVs of healthy and lesion tissue, respectively, whereas blue represents AVs of voxels that are misclassified mostly because minor registration errors between the 4 different acquisitions (T1, T2, PD and FLAIR) causes them to have imaging profiles that are drastically different from the training set, and hence prone to misclassification.
Fig. 8
Fig. 8
Demonstration of false positive elimination via AV distance in Hilbert space. (a) Distance distribution of {dνi} (blue, true positives), {dνifL} (red, false positives) and the overlap between {dνi} and {dνifL} (violet). (b) Distance distribution of {dνin} (blue, true negatives), {dνifN} (red, false positives) and the overlap between {dνin} and {dνifN} (violet). WML segmentation results (c) before false positive elimination, and (d) after false positive elimination via thresholding the distance map.
Fig. 9
Fig. 9
Demonstration of orbital false positive elimination. Left: orbital false positives (red) overlaid on FLAIR before false positive elimination; Right: After orbital false positive elimination.
Fig. 10
Fig. 10
Comparison of WML segmentation results between gold standard and computer-assisted segmentation for two individual subjects. In subject 1, gold standard and computer-assisted lesion measurements are 11714.9 mm3 and 12397.9 mm3 respectively; in subject 2, gold standard and computer-assisted lesion measures are 15978.5 mm3 and 17884.9 mm3 respectively.
Fig. 11
Fig. 11
A zoomed part of ROC curve of our segmentation algorithm. The ‘*’ indicates the result of the 2nd rater compared to gold standard (1st rater). Other symbols on the curve denote different thresholds, i.e., ‘△’ threshold = −0.15, ‘+’ threshold = 0.0, ‘○’ threshold = 0.05, ‘□’ threshold = 0.2 (see Fig. 6. for definition of threshold).
Fig. 12
Fig. 12
95% CI (Confidence Intervals) for gold standard (1st rater), 2nd rater and computer assisted segmentation method (Computer) over 35 subjects respectively. Volume measurements are mm3.

References

    1. Prins ND, et al. Cerebral White Matter Lesions and the Risk of Dementia. Archives of Neurology. 2004;61(10):1531–1534. - PubMed
    1. Snowdon DA, et al. Brain infarction and the clinical expression of Alzheimer's disease. The Nun study. JAMA. 1997;277(10):813–817. - PubMed
    1. Schneider JA, et al. Relation of cerebral infarctions to dementia and cognitive function in older persons. Neurology. 2003;60(7):1082–1088. - PubMed
    1. Schneider JA, et al. Cerebral infarctions and the likelihood of dementia from Alzheimer disease pathology. Neurology. 2004;62(7):1148–1155. - PubMed
    1. Vermeerx SE, et al. Silent brain infarcts and the risk of dementia and cognitive decline. The new england journal of medicine. 2003;348:1215–1222. - PubMed

Publication types