. 2008 Apr 18;283(16):10522-34.
doi: 10.1074/jbc.M707659200. Epub 2008 Feb 14.

Targeted depletion of hepatic ACAT2-driven cholesterol esterification reveals a non-biliary route for fecal neutral sterol loss

Affiliations

Targeted depletion of hepatic ACAT2-driven cholesterol esterification reveals a non-biliary route for fecal neutral sterol loss

J Mark Brown et al. J Biol Chem. .

Abstract

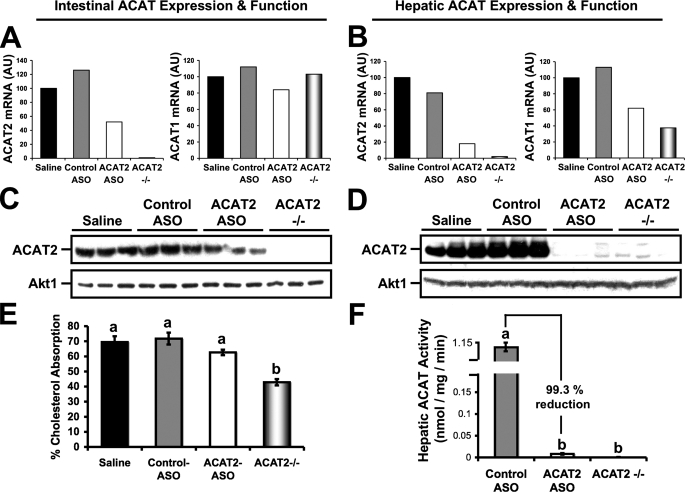
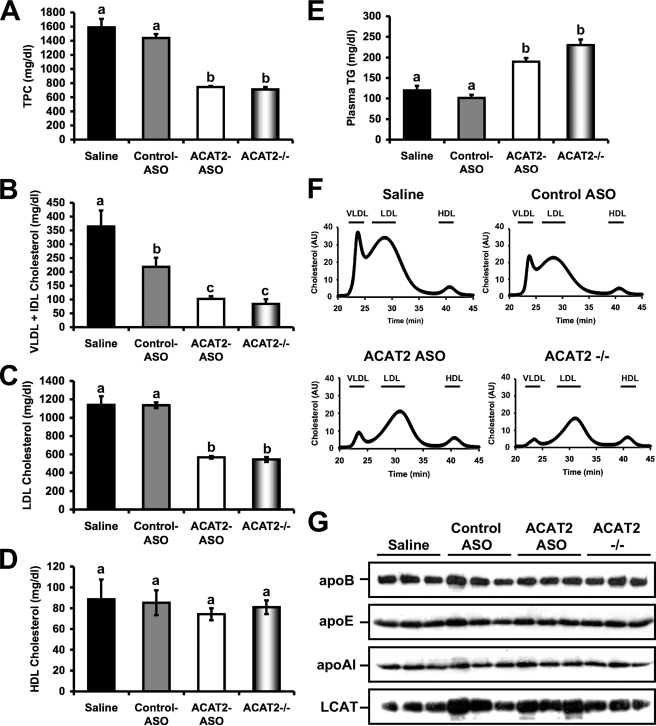
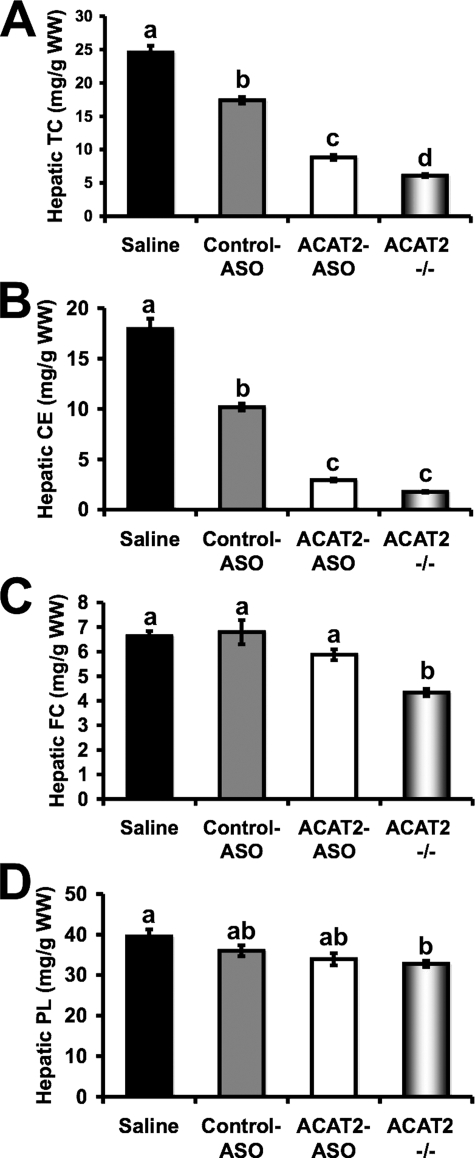
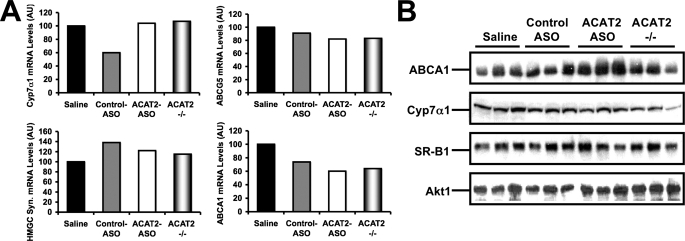
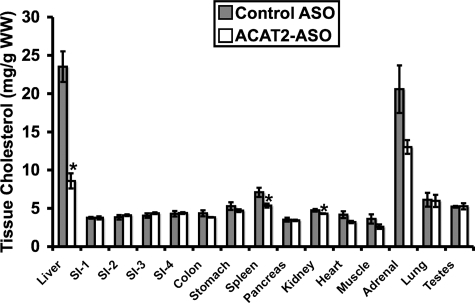
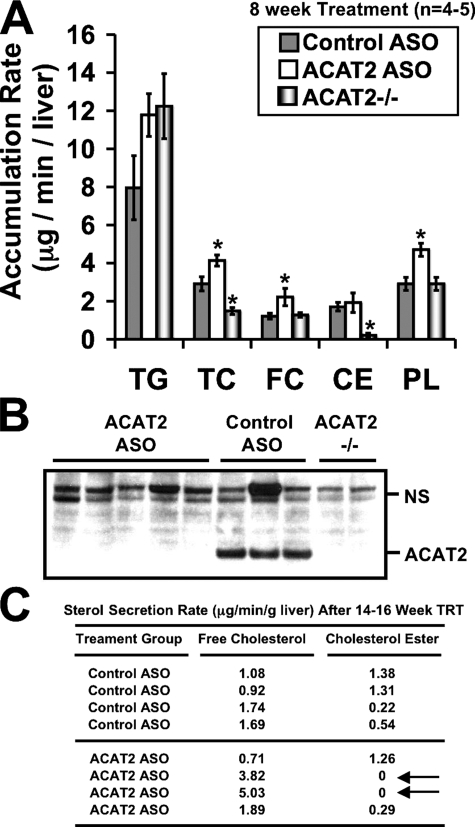
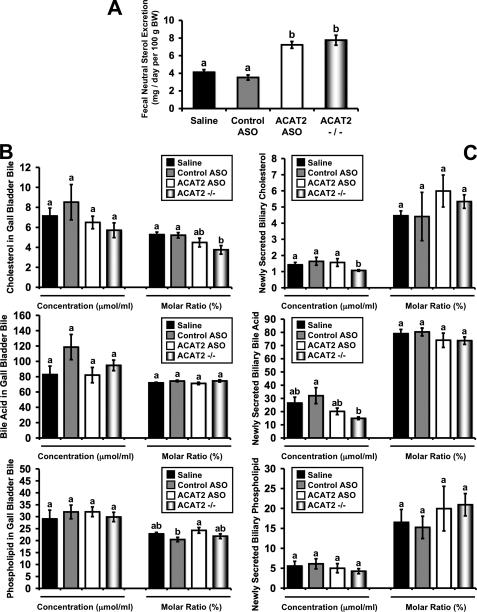
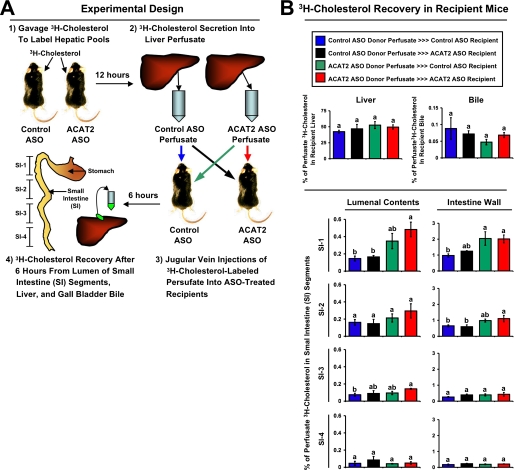
Deletion of acyl-CoA:cholesterol O-acyltransferase 2 (ACAT2) in mice results in resistance to diet-induced hypercholesterolemia and protection against atherosclerosis. Recently, our group has shown that liver-specific inhibition of ACAT2 via antisense oligonucleotide (ASO)-mediated targeting likewise limits atherosclerosis. However, whether this atheroprotective effect was mediated by: 1) prevention of packaging of cholesterol into apoB-containing lipoproteins, 2) augmentation of nascent HDL cholesterol secretion, or 3) increased hepatobiliary sterol secretion was not examined. Therefore, the purpose of these studies was to determine whether hepatic ACAT2 is rate-limiting in all three of these important routes of cholesterol homeostasis. Liver-specific depletion of ACAT2 resulted in reduced packaging of cholesterol into apoB-containing lipoproteins (very low density lipoprotein, intermediate density lipoprotein, and low density lipoprotein), whereas high density lipoprotein cholesterol levels remained unchanged. In the liver of ACAT2 ASO-treated mice, cholesterol ester accumulation was dramatically reduced, yet there was no reciprocal accumulation of unesterified cholesterol. Paradoxically, ASO-mediated depletion of hepatic ACAT2 promoted fecal neutral sterol excretion without altering biliary sterol secretion. Interestingly, during isolated liver perfusion, ACAT2 ASO-treated livers had augmented secretion rates of unesterified cholesterol and phospholipid. Furthermore, we demonstrate that liver-derived cholesterol from ACAT2 ASO-treated mice is preferentially delivered to the proximal small intestine as a precursor to fecal excretion. Collectively, these studies provide the first insight into the hepatic itinerary of cholesterol when cholesterol esterification is inhibited only in the liver, and provide evidence for a novel non-biliary route of fecal sterol loss.


Figures

FIGURE 1.
FIGURE 1.
ASO-mediated knockdown of ACAT2 is liver-specific. Male LDLr-/-, apoB100-only mice were fed a low-fat (20% of energy as fat), moderate cholesterol (0.1%, w/w) diet for 8 weeks in conjunction with biweekly injections (25 mg/kg) of saline, a non-targeting ASO (control ASO), or an ASO targeting the knockdown of ACAT2 (ACAT2 ASO). Mice with targeted gene deletion of ACAT2 were treated with saline as a total body knock-out control (ACAT2-/-). Relative quantitation of ACAT1 and ACAT2 mRNA transcripts in proximal small intestine (A) or liver (B) was conducted by real-time PCR as described under “Experimental Procedures.” Data shown in panels A and B represent pooled RNA samples with n = 5 mice per group. Panels C and D represent Western blot analysis of ACAT2 and Akt1 protein expression in proximal small intestine (C) or liver (D) homogenates (n = 3 per group). Panel E represents fractional cholesterol absorption measured by the fecal dual-isotope method. Data in panel E represent the mean ± S.E. from seven to nine mice per group, and values not sharing a common superscript differ significantly (p < 0.05). Panel F represents hepatic ACAT activity of cholesterol pre-loaded liver microsomes. Data in panel F represent the mean ± S.E. from four to five mice per group, and values not sharing a common superscript differ significantly (p < 0.05).
FIGURE 2.
FIGURE 2.
ASO-mediated knockdown of ACAT2 reduces cholesterol packaging into apoB-containing lipoproteins, without affecting HDL cholesterol levels. Male LDLr-/-, apoB100-only mice were fed a low-fat (20% of energy as fat), moderate cholesterol (0.1%, w/w) diet for 8 weeks in conjunction with biweekly injections (25 mg/kg) of saline, a non-targeting ASO (control ASO), or an ASO targeting the knockdown of ACAT2 (ACAT2 ASO). Mice with targeted gene deletion of ACAT2 were treated with saline as a total body knock-out control (ACAT2-/-). Fasting plasma samples were separated by size exclusion chromatography and enzymatically analyzed to quantify: A, total plasma cholesterol; B, very low density lipoprotein and intermediate-density lipoprotein cholesterol (VLDL + IDL); C, LDL cholesterol; D, HDL cholesterol; and E, whole plasma TG. Panel F represents the cholesterol distribution of plasma lipoprotein fractions determined by size exclusion chromatography coupled to online cholesterol analysis, where 30 μl of pooled plasma (n = 5 per group) was applied to a FPLC Superose 6 column and cholesterol concentration is expressed in arbitrary units (AU). Panel G represents quantification of whole plasma apolipoprotein B (apoB), apolipoprotein E (apoE), apolipoprotein A-I (apoA-I), and LCAT levels by Western blotting (n = 3 per group). Data represented in panels AE represent the mean ± S.E. from seven to nine mice per group, and values not sharing a common superscript differ significantly (p < 0.05).
FIGURE 3.
FIGURE 3.
ASO-mediated depletion of ACAT2 reduces hepatic cholesterol esterification, yet does not cause free cholesterol accumulation in the liver. Male LDLr-/-, apoB100-only mice were fed a low-fat (20% of energy as fat), moderate cholesterol (0.1%, w/w) diet for 8 weeks in conjunction with biweekly injections (25 mg/kg) of saline, a non-targeting ASO (control ASO), or an ASO targeting the knockdown of ACAT2 (ACAT2 ASO). Mice with targeted gene deletion of ACAT2 were treated with saline as a total body knock-out control (ACAT2-/-). Fasting liver samples were extracted and enzymatically analyzed to quantify the mass of: A, TC; B, CE; C, FC; and D, PL. All hepatic lipid values were normalized to the wet weight of the extracted tissue, and represent the mean ± S.E. from seven to nine mice per group. Values not sharing a common superscript differ significantly (p < 0.05).
FIGURE 4.
FIGURE 4.
The hepatic expression of cholesterol-sensitive genes. A, the hepatic expression of ATP binding cassette transporter A1 (ABCA1), ATP binding cassette transporter A5 (ABCG5), 3-hydroxy-3-methylglutaryl-CoA synthase 1 (HMGC syn.), and Cyp7α1 were measured in pooled samples (n = 5) by quantitative PCR as described under “Experimental Procedures.” B, the hepatic protein expression of ABCA1, Cyp7α1, scavenger receptor-BI (SR-BI), and Akt1 were measured by Western blotting in individual mice (n = 3 per group), as described under “Experimental Procedures.”
FIGURE 5.
FIGURE 5.
ASO-mediated depletion of hepatic cholesterol esterification does not result in cholesterol accumulation in extrahepatic tissues. Male LDLr-/-, apoB100-only mice were fed a low-fat (20% of energy as fat), moderate cholesterol (0.1%, w/w) diet for 8 weeks in conjunction with biweekly injections (25 mg/kg) of either a non-targeting ASO (control ASO) or an ASO targeting the knockdown of ACAT2 (ACAT2 ASO). Thereafter, multiple tissues were extracted and analyzed to determine total cholesterol content of each tissue. All cholesterol mass values were normalized to the wet weight of the extracted tissue, and represent the mean ± S.E. from 4 mice per group. Asterisk, significantly different from the control ASO group within each lipid classification (p < 0.05). SI was segmented into 4 equal parts and is represented proximal to distal as SI-1, SI-2, SI-3, and SI-4.
FIGURE 6.
FIGURE 6.
Depletion of hepatic ACAT2 results in augmented free cholesterol and phospholipid secretion during isolated liver perfusion. Male LDLr-/-, apoB100-only mice were fed a low-fat (20% of energy as fat), moderate cholesterol (0.1%, w/w) diet for 8 weeks (A and B) or 14–16 weeks (C) in conjunction with biweekly injections (25 mg/kg) of a non-targeting ASO (control ASO) or an ASO targeting the knockdown of ACAT2 (ACAT2 ASO). Mice with targeted gene deletion of ACAT2 were treated with saline for 8 weeks as a total body knock-out control (ACAT2-/-). Thereafter, isolated liver perfusions were carried out to determine the mass accumulation rates of TG, TC, CE, FC, and PL. Data in panel A represent the mean ± S.E. from 5 control ASO-treated mice, 5 ACAT2 ASO-treated mice, and 4 ACAT2-/- mice; asterisk, significantly different from the control ASO group within each lipid classification (p < 0.05). Panel B represents Western blot confirmation that ACAT2 protein was not detectable in the ACAT2 ASO-treated or ACAT2-/- livers used for perfusion following 8 weeks of treatment. NS, nonspecific background band that serves as a loading control. Panel C represents a subset of mice that were chronically (14–16 weeks) treated with ASOs. Lipid accumulation rates in panel C were determined by gas-liquid chromatography.
FIGURE 7.
FIGURE 7.
ASO-mediated depletion of hepatic ACAT2 promotes fecal neutral sterol excretion without altering biliary sterol secretion. Male LDLr-/-, apoB100-only mice were fed a low-fat (20% of energy as fat), moderate cholesterol (0.1%, w/w) diet for 8 weeks in conjunction with biweekly injections (25 mg/kg) of saline, a non-targeting ASO (control ASO), or an ASO targeting the knockdown of ACAT2 (ACAT2 ASO). Mice with targeted gene deletion of ACAT2 were treated with saline as a total body knock-out control (ACAT2-/-). A, feces were collected for 3 days and the mass amount of fecal neutral sterol was determined by gas-liquid chromatography. Data shown in panel A represent the mean ± S.E. from seven to nine mice per group, and values not sharing a common superscript differ significantly (p < 0.05). B, cholesterol, bile acid, and phospholipid concentrations in gall bladder bile. Data shown in panel B represent the mean ± S.E. from six to seven mice per group, and values not sharing a common superscript differ significantly (p < 0.05). C, newly secreted biliary cholesterol, bile acid, and phospholipid concentrations following common bile duct cannulation collections. Data shown in panel C represent the mean ± S.E. from four to six mice per group, and values not sharing a common superscript differ significantly (p < 0.05).
FIGURE 8.
FIGURE 8.
ASO-mediated depletion of hepatic ACAT2 promotes non-biliary intestinal secretion of cholesterol. A represents the experimental design for this study. Briefly, control ASO and ACAT2 ASO-treated mice (n = 3 donor mice per group) were gavaged with 50 μCi of [3H]cholesterol, and 12 h later isolated liver perfusions were done to collect perfusate samples that contained newly secreted liver-derived lipoprotein-associated [3H]cholesterol. Aliquots of [3H]cholesterol-labeled perfusate were introduced intravenously into recipient mice that had been treated with either a control ASO or ACAT2 ASO. Six hours later, gall bladder bile, liver, SI lumenal contents, and small intestine wall were collected to determine [3H]cholesterol recovery. The SI was segmented into 4 equal parts and is represented proximal to distal as SI-1, SI-2, SI-3, and SI-4. B represents the [3H]cholesterol recovery in recipient mice, and the colored bars should be referenced to donor-recipient crossover design that is represented by similar colored arrows in A. All data in B are expressed as a percentage (%) of the original injected [3H]cholesterol-labeled perfusate dose recovered in each tissue compartment. Bile data is represented as the % of [3H]cholesterol-labeled perfusate dose found in 10 μl of gall bladder bile. Data shown represent the mean ± S.E. from three to four recipient mice per group, and values not sharing a common superscript differ significantly (p < 0.05).

Comment in

Similar articles

Cited by

References

    1. Dietschy, J. M., and Turley, S. D. (2002) J. Biol. Chem. 277 3801-3804 - PubMed
    1. Dietschy, J. M., Turley, S. D., and Spady, D. K. (1993) J. Lipid Res. 34 1637-1659 - PubMed
    1. Horton, J. D., Goldstein, J. L., and Brown, M. S. (2002) J. Clin. Investig. 109 1125-1131 - PMC - PubMed
    1. Brown, M. S., Kovanen, P. T., and Goldstein, J. L. (1981) Science 212 628-635 - PubMed
    1. Turley, S. D., and Dietshcy, J. M. (2003) Curr. Opin. Lipidol. 14 233-240 - PubMed

Publication types