

doi: 10.1074/jbc.M800102200.
Epub 2008 Feb 15.
Mitochondrial autophagy is an HIF-1-dependent adaptive metabolic response to hypoxia
Affiliations
- PMID: 18281291
- PMCID: PMC2447655
- DOI: 10.1074/jbc.M800102200
Item in Clipboard
Mitochondrial autophagy is an HIF-1-dependent adaptive metabolic response to hypoxia
J Biol Chem.
.
Retraction in
-
Withdrawal: Mitochondrial autophagy is an HIF-1-dependent adaptive metabolic response to hypoxia.J Biol Chem. 2023 Aug;299(8):105125. doi: 10.1016/j.jbc.2023.105125. Epub 2023 Aug 7. J Biol Chem. 2023. PMID: 37556879 Free PMC article. No abstract available.
Abstract
Autophagy is a process by which cytoplasmic organelles can be catabolized either to remove defective structures or as a means of providing macromolecules for energy generation under conditions of nutrient starvation. In this study we demonstrate that mitochondrial autophagy is induced by hypoxia, that this process requires the hypoxia-dependent factor-1-dependent expression of BNIP3 and the constitutive expression of Beclin-1 and Atg5, and that in cells subjected to prolonged hypoxia, mitochondrial autophagy is an adaptive metabolic response which is necessary to prevent increased levels of reactive oxygen species and cell death.
Figures
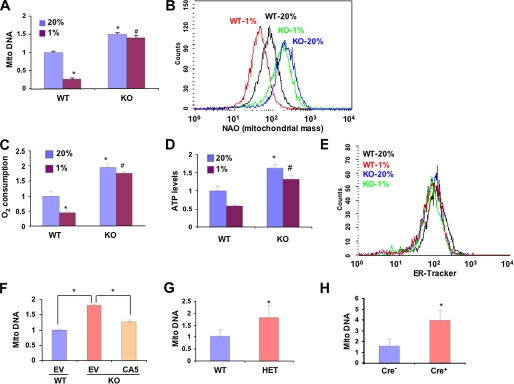
Regulation of mitochondrial mass and respiration by HIF-1 ex
vivo and in vivo. A, the ratio of
mitochondrial:nuclear DNA was determined by quantitative real-time PCR in wild
type (WT) and
Hif1a-/- (KO) MEFs
exposed to 20 or 1% O2 for 48 h and normalized to the results
obtained for WT cells at 20% O2. Mean values are shown
(±S.E.). *, p < 0.05 by Student's t
test compared with WT MEFs at 20% O2;#, p < 0.05
compared with WT MEFs at 1% O2. B, WT and KO MEFs were
exposed to 20 or 1% O2 for 48 h. Equal numbers of cells were
stained with nonyl acridine orange (NAO) and analyzed by flow
cytometry to measure mitochondrial mass. C and D,
O2 consumption (C) and ATP levels (D) were
measured in WT and KO MEFs exposed to 20 or 1% O2 for 48 h and
normalized to the results obtained for WT MEFs at 20% O2. Mean
values are shown (±S.E.). *, p < 0.05 by
Student's t test compared with WT MEFs at 20% O2;#,
p < 0.05 compared with WT MEFs at 1% O2. E, WT
and KO MEFs were exposed to 20 or 1% O2 for 48 h. Equal numbers of
cells were stained with ER-Tracker and analyzed by flow cytometry to measure
endoplasmic reticulum mass. F, WT and KO MEFs were transduced with
empty retroviral vector (EV) or vector encoding constitutively active
HIF-1α (CA5). After 3 days the ratio of mitochondrial:nuclear
DNA was determined. Mean values are shown (±S.E.). *,
p < 0.05 for indicated comparison. G and H, DNA
was isolated from lungs of WT and
Hif1a+/- HIF-1α-HET
littermate mice (G) or Arntflox/flox
HIF-1β-conditional-knock-out mice that were either transgenic
(Cre+) or non-transgenic (Cre-) for
Tie2-Cre (H). The ratio of mitochondrial: nuclear DNA was
determined by real-time PCR and normalized to the results obtained for WT
(G) or Cre- (H) mice. *, mean
(± S.E., n = 3) that is significantly different from WT or
Cre-.
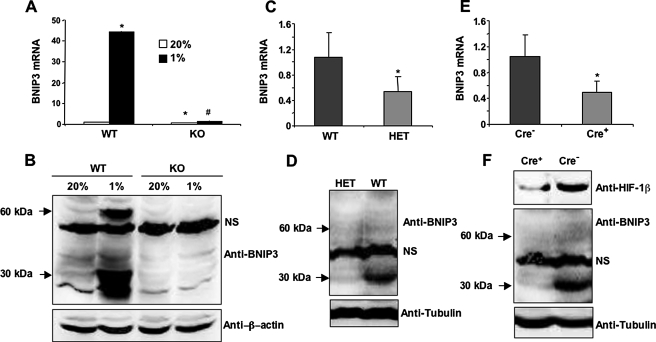
HIF-1-dependent induction of BNIP3 expression in hypoxic MEFs.
A, BNIP3 mRNA was measured by quantitative real-time RT-PCR in WT and
KO MEFs exposed to 20 or 1% O2 for 24 h. Mean values (±S.E.)
are shown. *, p < 0.05 by Student's t test
compared with WT MEFs at 20% O2;#, p < 0.05 compared
with WT MEFs at 1% O2. B, BNIP3 and β-actin protein
expression was measured by immunoblot assay using lysates from WT and KO MEFs
exposed to 20 or 1% O2 for 48 h. C and D, BNIP3
mRNA (C) and protein (D) expression were analyzed in WT and
HET mouse lung tissues. *, mean (±S.E., n = 3) that
is significantly different from WT. Anti-tubulin immunoblot assay was
performed to confirm equal protein loading. E and F, BNIP3
mRNA (E) and protein (F) levels were analyzed in
Cre- and Cre+ mouse lung tissues. *, mean
(±S.E., n = 3) that is significantly different from
Cre-. Tubulin served as loading control. NS indicates a
nonspecific band.
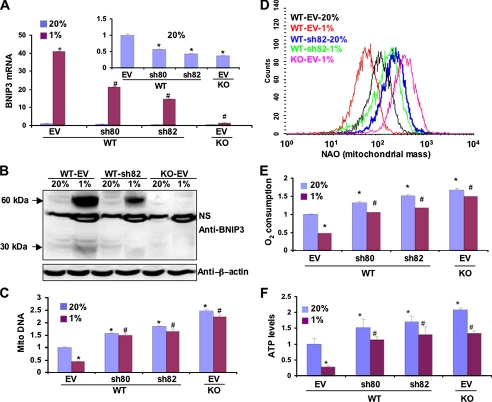
Effect of BNIP3 loss-of-function on mitochondrial mass and respiration
in WT and KO MEFs. A and B, quantitative real-time
RT-PCR (A) and immunoblot analysis (B) showed
down-regulation of BNIP3 mRNA and protein, respectively, by short hairpin RNAs
sh80 and sh82 in cells incubated at 20 or 1% O2 for 24 h
(A) or 48 h (B). β-Actin blot showed equal protein
loading. NS, nonspecific band. C, D, E, and F,
mitochondrial DNA content (C), mitochondrial mass (D),
O2 consumption (E), and ATP levels (F) were
measured in MEF subclones that were stably transfected with EV or vector
encoding sh80 or sh82 and cultured at 20 or 1% O2 for 48 h. Data
are presented as the mean (±S.E.). *, p < 0.05
by Student's t test compared with WT-EV MEFs at 20% O2;#,
p < 0.05 compared with WT-EV MEFs at 1% O2.
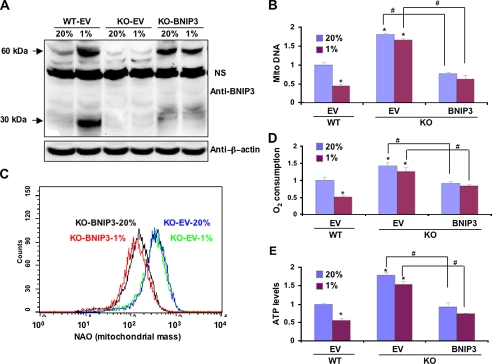
Effect of BNIP3 gain-of-function on mitochondrial mass and respiration
in WT and KO MEFs. A, immunoblot analysis showed expression of
BNIP3 protein in KO-BNIP3 MEFs cultured at 20 or 1% O2 for 48 h.
β-Actin served as a loading control. NS, nonspecific band.
Mitochondrial DNA content (B), mitochondrial mass (C),
O2 consumption (D), and ATP levels (E) were
measured in WT-EV, KO-EV, and KO-BNIP3 MEFs cultured at 20 or 1% O2
for 48 h. Data are presented as the mean (±S.E.). *,
p < 0.05 by Student's t test compared with WT-EV MEFs at
20% O2;#, p < 0.05 for the indicated comparison
(bent lines).
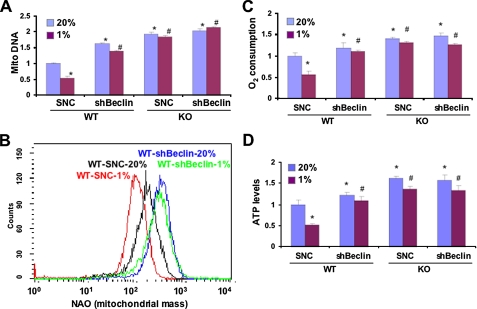
Beclin-1 is required for HIF-1-dependent regulation of mitochondrial
mass and respiration in MEFs. Subclones of WT and KO MEFs expressing short
hairpin RNA directed against Beclin-1 (shBeclin) or a scrambled
negative control (SNC) were cultured at 20 or 1% O2 for 48
h. Mitochondrial DNA content (A), mitochondrial mass (B),
O2 consumption (C), and ATP levels (D) were
measured. Mean values are shown (±S.E.). *, p <
0.05 by Student's t test compared with WT-SNC at 20% O2;#,
p < 0.05 compared with WT-SNC at 1% O2.
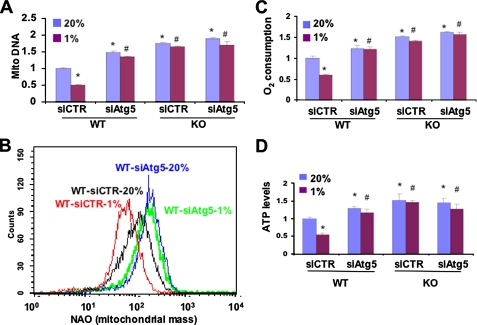
Atg5 is required for HIF-1-dependent regulation of mitochondrial mass
and respiration in MEFs. WT and KO MEFs were transfected with siRNA
directed against Atg5 (siAtg5) or a control siRNA (siCTR)
and cultured at 20 or 1% O2 for 48 h. Mitochondrial DNA content
(A), mitochondrial mass (B), O2 consumption
(C), and ATP levels (D) were measured. Mean values are shown
(±S.E.). *, p < 0.05 by Student's t
test compared with WT-siCTR at 20% O2;#, p < 0.05
compared with WT-siCTR at 1% O2.
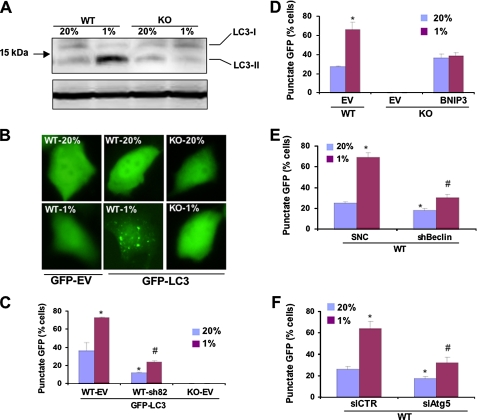
HIF-1 activates BNIP3-, Beclin-1-, and Atg5-dependent autophagy in
hypoxic MEFs. A, WT and KO MEFs were incubated at 20 or 1%
O2 for 48 h, and whole cell lysates were subjected to immunoblot
assay using an anti-LC3 antibody. B, WT and KO MEFs were transiently
transfected with vector encoding GFP or GFP-LC3, incubated at 20% or 1%
O2, and analyzed by fluorescence microscopy. C, KO-EV MEFs
and WT MEF subclones, which were stably transfected with EV or vector
expressing short hairpin RNA directed against BNIP3 (sh82), were transiently
transfected with vector GFP-LC3, cultured at 20 or 1% O2, and
analyzed by fluorescence microscopy. The percentage of cells exhibiting
punctate fluorescence was calculated relative to all GFP-positive cells. Mean
data (±S.E.) are shown. *, p < 0.05 compared
with GFP-LC3-transfected WT-EV MEFs at 20% O2;#, p <
0.05 compared with GFP-LC3-transfected WT-EV MEFs at 1% O2.
D, the percentage of cells with punctuate GFP-LC3 fluorescence was
calculated relative to all fluorescent cells in WT-EV, KO-EV, and KO-BNIP3 MEF
subclones. *, p < 0.05 compared with WT-EV at 20%
O2. E, the percentage of cells with punctuate GFP-LC3
fluorescence was calculated in WT MEF subclones expressing short hairpin RNA
directed against Beclin1 (shBeclin) or a SNC. Mean data
(±S.E.) are shown. *, p < 0.05 compared with
WT-SNC at 20% O2;#, p < 0.05 compared with WT-SNC at 1%
O2. F, the percentage of cells with punctuate GFP-LC3
fluorescence was calculated in WT MEF subclones expressing small interfering
RNA against Atg5 (siAtg5) or a negative control siRNA
(siCTR). Mean data (±S.E.) are shown. *, p
< 0.05 compared with WT-siCTR at 20% O2;#, p < 0.05
compared with WT-siCTR at 1% O2.
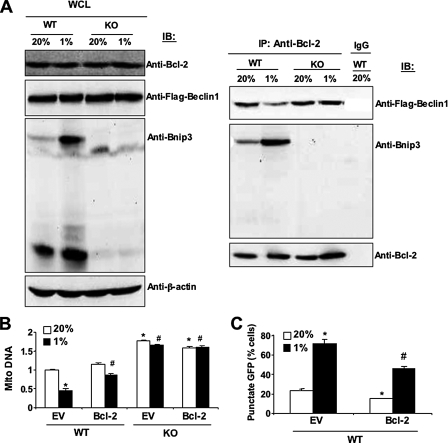
BNIP3 competes with Beclin-1 for binding to Bcl2. A, MEFs
were exposed to 20 or 1% O2 for 48 h, whole cell lysates
(WCL) were prepared, and aliquots were subjected to direct immunoblot
assays (IB, left panel) or after immunoprecipitation (IP)
with anti-Bcl2 antibody (right panel). B and C,
MEFs stably transfected with EV or vector encoding Bcl2 were exposed to 20 or
1% O2 for 48 h and analyzed for mitochondrial:nuclear DNA ratio
(B) or punctate fluorescence of GFP-LC3 (C). Mean data
(±S.E.) are shown. *, p < 0.05 compared with
WT-EV at 20% O2;#, p < 0.05 compared with WT-EV at 1%
O2.
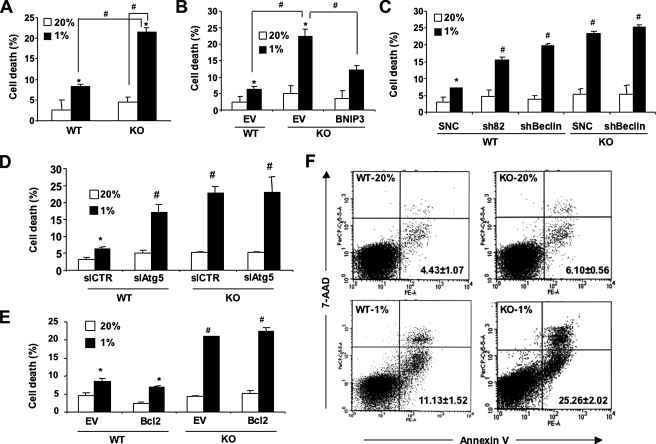
Protective effect of HIF-1/BNIP3/Beclin/Atg6-induced autophagy in
hypoxic cells. A, B, C, D, and E, the indicated MEF
subclones were cultured at 20 or 1% O2 for 48 h, and the number of
dead cells as a percentage of total cell number was determined by trypan blue
staining. Mean data (±S.E.) are shown. *, p <
0.05 by Student's t test compared with the control WT MEF subclone in
the first column of each bar graph. #, p < 0.05 for indicated
comparison (A and B) or compared with WT-SNC (C),
siCTR (D), or WT-EV (E) at 1% O2. F,
MEFs were cultured at 20 or 1% O2 for 48 h and then incubated with
7-AAD and phosphatidylethanolamine-labeled anti-annexin V antibody for flow
cytometric analysis of apoptosis. The percentage (mean ± S.E.) of
annexin+/7-AAD- cells are shown.
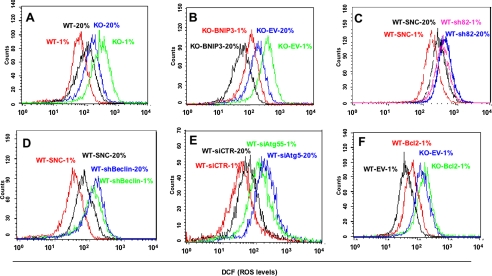
Analysis of ROS levels. Equal numbers of the indicated MEF subclones
were cultured at 20 or 1% O2 for 48 h and stained with 1
μm dichlorodihydrofluorescein diacetate, and oxidative
metabolism to dichlorofluorescein (DCF) was determined by flow
cytometry.
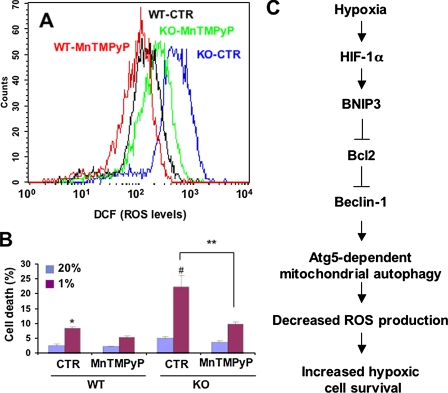
ROS scavenger rescues HIF-1α-deficient MEFs from
hypoxia-induced cell death. MEFs were exposed to 20 or 1% O2
for 48 h in the presence of 25 μm MnTMPyP, a superoxide
dismutase mimetic, or vehicle control (CTR). A, ROS levels
were quantified by dichlorofluorescein (DCF) fluorescence.
B, percent cell death (mean ± S.E.) was quantified by trypan
blue staining. *, p < 0.05 by Student's t test
compared with WT-CTR at 20% O2;#, p < 0.05 compared
with WT-CTR at 1% O2; **, p < 0.05 for
indicated comparison. C, molecular pathway regulating mitochondrial
autophagy, cell respiration, ROS levels, and cell survival in MEFs subjected
to prolonged hypoxia.
References
Publication types
MeSH terms
Substances
Grants and funding
LinkOut - more resources
Full Text Sources
Other Literature Sources
Molecular Biology Databases
