. 2008 Jun;94(11):4233-48.
doi: 10.1529/biophysj.107.116970. Epub 2008 Feb 15.

Formation of the open complex by bacterial RNA polymerase--a quantitative model

Affiliations

Formation of the open complex by bacterial RNA polymerase--a quantitative model

Marko Djordjevic et al. Biophys J. 2008 Jun.

Abstract

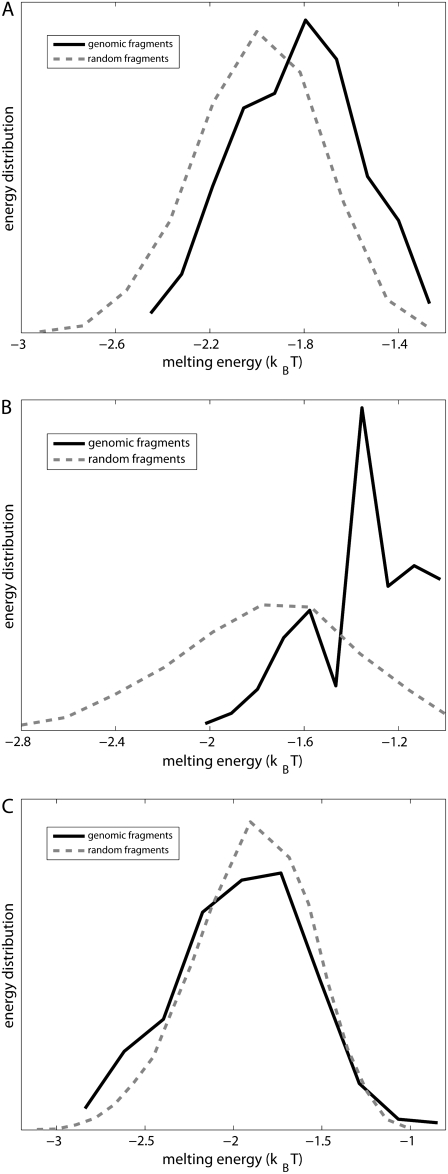
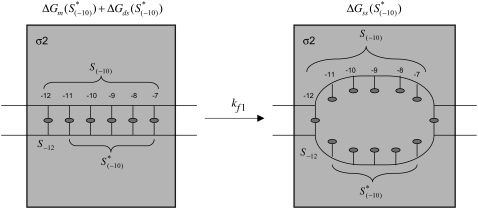
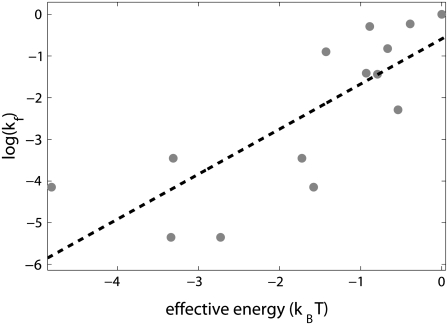
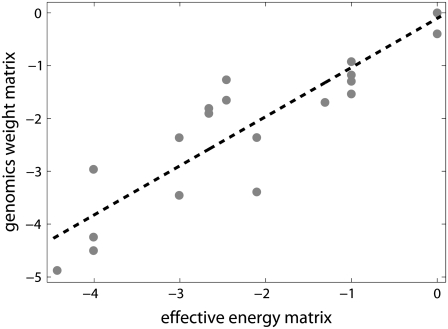
Over the last two decades, a large amount of data on initiation of transcription by bacterial RNA polymerase (RNAP) has been obtained. However, a question of how the open complex is formed still remains open, and several qualitative hypotheses for opening of DNA by RNAP have been proposed. To provide a theoretical framework needed to analyze the assembled experimental data, we here develop the first quantitative model of the open complex formation by bacterial RNAP. We first show that a simple hypothesis (which might follow from recent bioinformatic and experimental results), by which promoter DNA is melted in one step through thermal fluctuations, is inconsistent with experimental data. We next consider a more complex two-step view of the open complex formation. According to this hypothesis, the transcription bubble is formed in the -10 region, and consequently extends to the transcription start site. We derive how the open complex formation rate depends on DNA duplex melting energy and on interaction energies of RNAP with promoter DNA in the closed and open complex. This relationship provides an explicit connection between transcription initiation rate and physical properties of the promoter sequence and promoter-RNAP interactions. We compare our model with both biochemical measurements and genomics data and report a very good agreement with the experiments, with no free parameters used in model testing. This agreement therefore strongly supports both the quantitative model that we propose and the qualitative hypothesis on which the model is based. From a practical point, our results allow efficient estimation of promoter kinetic parameters, as well as engineering of promoter sequences with the desired kinetic properties.


Figures

FIGURE 1
FIGURE 1
Melting energies of promoter fragments compared to random genomic background. The values on the horizontal axis give the sequence-specific part of the melting energy scaled by the fragment length (i.e., melting energy per basepair). The dashed-lines give energy distributions for randomly generated DNA fragments. Melting energies are calculated at the physiological values of temperature and salt concentration (37°C and 0.15 M, respectively), and the parameters used in calculations are summarized in Blake et al. (24). (A) The solid line shows the energy distribution corresponding to the genomic fragments that include the entire −10 box and span up to position +2, relative to transcription start. (B) The solid line shows the energy distribution of 6-bp-long genomic fragments corresponding to just −10 promoter regions. (C) The solid line shows the energy distribution of genomic fragments spanning from the downstream edge of the −10 promoter element (position −6) to just upstream of transcription start site (position +2).
FIGURE 2
FIGURE 2
Illustration of the first step in the open complex formation. The left-hand side of the figure illustrates interaction of σ with the −10 region in the closed complex. The right-hand side of the figure indicates the melted −10 box, which corresponds to the intermediate open complex. Six bases that correspond to the −10 box are indicated by their positions (−12 to −7) relative to the transcription start site. The transition, with the rate kf1, from closed to intermediate open complex is indicated by the arrow. The shaded square indicates σ2 domain, which interacts with the −10 region. The energies that correspond to the closed and open states, as well as the sequence notation that is used in the text are indicated in the figure.
FIGURE 3
FIGURE 3
Comparison of the model with biochemical data. The values on the vertical axis give the logarithm of the experimentally measured rates of transition from closed to open complex kf, and correspond to measurements at 25°C and 0.1 M salt concentration (16). All kf values are scaled with the transition rate that corresponds to the consensus −10 box sequence. The values on the horizontal axis give the effective energy in units of kBT (kBT ∼ 0.6 kcal/mol). The zero of energy coincides with the effective energy of the consensus −10 box sequence. The values of melting energy, which enter the expression for the effective energy, were calculated for each sequence by using MFOLD (43), under the same conditions as those in kf measurements. Interaction energies of RNAP with DNA in duplex form, and in the form that mimics the intermediate open complex, were inferred from binding measurements in Fenton and Gralla (11). The conditions for the binding measurements in Fenton and Gralla (11) were 0°C (to reduce melting of DNA upon RNAP binding to DNA in duplex form) and 0.1 M salt concentration, while RNAP was in large excess over DNA probes (the respective concentrations were 100 nM and 1 nM). The dashed line is the linear fit to the data.
FIGURE 4
FIGURE 4
Comparison of the model with genomics data. The values on the vertical axis are elements of the genomics weight matrix, which correspond to −10 region. The genomics weight matrix was constructed based on experimentally determined transcription start sites assembled in RegulonDB database (17). The values on the horizontal axis are the corresponding elements of the effective energy matrix, in units of kBT. The melting energy part of the effective energy matrix was calculated based on the parameters summarized in Blake et al. (24), at physiological conditions (37°C and 0.15 M, respectively) under which most of the experimentally determined transcription start sites are likely sampled. The source of data and the experimental conditions used to infer interaction energies of RNAP with DNA that enter the effective energy matrix are the same as those in the legend of Fig. 3. The zero at each column of the matrices is chosen to coincide with the consensus base at the given position in −10 box. (Note that an arbitrary base independent value can be added to each column of the weight matrix, which corresponds to shifting the position of zero of energy.) The dashed line is the linear fit to the data.

References

    1. Ebright, R. H. 2000. RNA polymerase: structural similarities between bacterial RNA polymerase and eukaryotic RNA polymerase II. J. Mol. Biol. 304:687–698. - PubMed
    1. Borukhov, S., and E. Nudler. 2003. RNA polymerase holoenzyme: structure, function and biological implications. Curr. Opin. Microbiol. 6:93–100. - PubMed
    1. DeHaseth, P. L., M. L. Zupancic, and M. T. Record, Jr. 1998. RNA polymerase-promoter interactions: the comings and goings of RNA polymerase. J. Bacteriol. 180:3019–3025. - PMC - PubMed
    1. Borukhov, S., and K. Severinov. 2002. Role of the RNA polymerase σ-subunit in transcription initiation. Res. Microbiol. 153:557–562. - PubMed
    1. Saecker, R. M., C. A. Davis, and M. T. Record, Jr. 2006. Do σ-factors need help with a meltdown? Cell. 127:256–258. - PubMed

Publication types

LinkOut - more resources