

Time-resolved FTIR difference spectroscopy in combination with specific isotope labeling for the study of A1, the secondary electron acceptor in photosystem 1
- PMID: 18281389
- PMCID: PMC2480661
- DOI: 10.1529/biophysj.107.113191
Time-resolved FTIR difference spectroscopy in combination with specific isotope labeling for the study of A1, the secondary electron acceptor in photosystem 1
Abstract
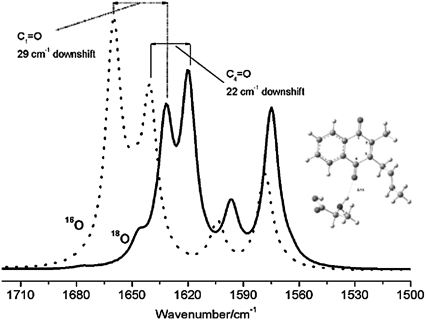
A phylloquinone molecule (2-methyl, 3-phytyl, 1, 4-naphthoquinone) occupies the A(1) binding site in photosystem 1 particles from Synechocystis sp. 6803. In menB mutant photosystem 1 particles from the same species, plastoquinone-9 occupies the A(1) binding site. By incubation of menB mutant photosystem 1 particles in the presence of phylloquinone, it was shown in another study that phylloquinone will displace plastoquinone-9 in the A(1) binding site. We describe the reconstitution of unlabeled ((16)O) and (18)O-labeled phylloquinone back into the A(1) binding site in menB photosystem 1 particles. We then produce time-resolved A(1)(-)/A(1) Fourier transform infrared (FTIR) difference spectra for these menB photosystem 1 particles that contain unlabeled and (18)O-labeled phylloquinone. By specifically labeling only the phylloquinone oxygen atoms we are able to identify bands in A(1)(-)/A(1) FTIR difference spectra that are due to the carbonyl (C=O) modes of neutral and reduced phylloquinone. A positive band at 1494 cm(-1) in the A(1)(-)/A(1) FTIR difference spectrum is found to downshift 14 cm(-1) and decreases in intensity on (18)O labeling. Vibrational mode frequency calculations predict that an antisymmetric vibration of both C=O groups of the phylloquinone anion should display exactly this behavior. In addition, phylloquinone that has asymmetrically hydrogen bonded carbonyl groups is also predicted to display this behavior. The positive band at 1494 cm(-1) in the A(1)(-)/A(1) FTIR difference spectrum is therefore due to the antisymmetric vibration of both C=O groups of one electron reduced phylloquinone. Part of a negative band at 1654 cm(-1) in the A(1)(-)/A(1) FTIR difference spectrum downshifts 28 cm(-1) on (18)O labeling. Again, vibrational mode frequency calculations predict this behavior for a C=O mode of neutral phylloquinone. The negative band at 1654 cm(-1) in the A(1)(-)/A(1) FTIR difference spectrum is therefore due to a C=O mode of neutral phylloquinone. More specifically, calculations on a phylloquinone model molecule with the C(4)=O group hydrogen bonded predict that the 1654 cm(-1) band is due to the non hydrogen bonded C(1)=O mode of neutral phylloquinone.
Figures


Similar articles
-
Time-resolved FTIR difference spectroscopy for the study of photosystem I particles with plastoquinone-9 occupying the A1 binding site.Biochemistry. 2006 Oct 24;45(42):12733-40. doi: 10.1021/bi0611199. Biochemistry. 2006. PMID: 17042491
-
Modification of the phylloquinone in the A1 binding site in photosystem I studied using time-resolved FTIR difference spectroscopy and density functional theory.Biochemistry. 2006 Apr 4;45(13):4121-7. doi: 10.1021/bi052145u. Biochemistry. 2006. PMID: 16566585
-
A1 reduction in intact cyanobacterial photosystem I particles studied by time-resolved step-scan Fourier transform infrared difference spectroscopy and isotope labeling.Biochemistry. 2005 Feb 15;44(6):1880-93. doi: 10.1021/bi0497493. Biochemistry. 2005. PMID: 15697214
-
Vibrational spectroscopy of photosystem I.Biochim Biophys Acta. 2015 Jan;1847(1):55-68. doi: 10.1016/j.bbabio.2014.07.014. Epub 2014 Jul 30. Biochim Biophys Acta. 2015. PMID: 25086273 Review.
-
Coupling of electron transfer to proton uptake at the Q(B) site of the bacterial reaction center: a perspective from FTIR difference spectroscopy.Biochim Biophys Acta. 2008 Oct;1777(10):1229-48. doi: 10.1016/j.bbabio.2008.06.012. Epub 2008 Jul 11. Biochim Biophys Acta. 2008. PMID: 18671937 Review.
Cited by
-
Time-resolved FTIR difference spectroscopy for the study of photosystem I with high potential naphthoquinones incorporated into the A1 binding site 2: Identification of neutral state quinone bands.Photosynth Res. 2023 Oct;158(1):1-11. doi: 10.1007/s11120-023-01036-8. Epub 2023 Jul 21. Photosynth Res. 2023. PMID: 37477846
-
Conformance Control in Oil Reservoirs by Citric Acid-Coated Magnetite Nanoparticles.ACS Omega. 2021 Mar 22;6(13):9001-9012. doi: 10.1021/acsomega.1c00026. eCollection 2021 Apr 6. ACS Omega. 2021. PMID: 33842770 Free PMC article.
-
Photosystem I with benzoquinone analogues incorporated into the A1 binding site.Photosynth Res. 2018 Jul;137(1):85-93. doi: 10.1007/s11120-018-0480-5. Epub 2018 Jan 13. Photosynth Res. 2018. PMID: 29332243
References
-
- Barber, J. 1992. The Photosystems: Structure, Function, and Molecular Biology. Elsevier Science, Amsterdam.
-
- Walker, D. 1993. Energy, Plants and Man. Oxygraphics, Mill Valley, CA.
-
- Ke, B. 2001. Photosynthesis: Photobiochemistry and Photobiophysics. Kluwer Academic Publishers, Boston, MA.
-
- Golbeck, J. 2006. Photosystem I The Light Driven Plastocyanin:Ferridoxin Oxidoreductase. Springer, Dordrecht, The Netherlands.
-
- Golbeck, J. H., and D. Bryant. 1991. Photosystem I. In Current Topics in Bioenergetics. Academic Press, New York. 83–175.
Publication types
MeSH terms
Substances
LinkOut - more resources
Full Text Sources
Miscellaneous
