. 2008 Apr;190(8):3026-35.
doi: 10.1128/JB.01798-07. Epub 2008 Feb 15.

Lgt: a family of cytotoxic glucosyltransferases produced by Legionella pneumophila

Affiliations

Lgt: a family of cytotoxic glucosyltransferases produced by Legionella pneumophila

Yury Belyi et al. J Bacteriol. 2008 Apr.

Abstract

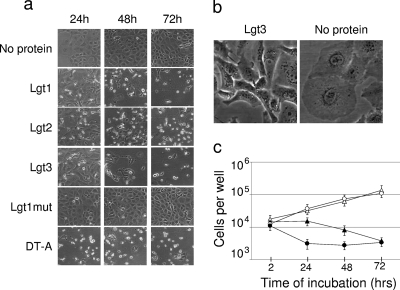
Legionella pneumophila is a facultative intracellular pathogen responsible for severe lung disease in humans, known as legionellosis or Legionnaires' disease. Previously, we reported on the approximately 60-kDa glucosyltransferase (Lgt1) from Legionella pneumophila, which modified eukaryotic elongation factor 1A. In the present study, using L. pneumophila Philadelphia-1, Lens, Paris, and Corby genome databases, we identified several genes coding for proteins with considerable sequence homology to Lgt1. These new enzymes form three subfamilies, termed Lgt1 to -3, glucosylate mammalian elongation factor eEF1A at serine-53, inhibit its activity, and subsequently kill target eukaryotic cells. Expression studies on L. pneumophila grown in broth medium or in Acanthamoeba castellanii revealed that production of Lgt1 was maximal at stationary phase of broth culture or during the late phase of Legionella-host cell interaction, respectively. In contrast, synthesis of Lgt3 peaked during the lag phase of liquid culture and at early steps of bacterium-amoeba interaction. Thus, the data indicate that members of the L. pneumophila glucosyltransferase family are differentially regulated, affect protein synthesis of host cells, and represent potential virulence factors of Legionella.


Figures

FIG. 1.
FIG. 1.
Amino acid alignment of Lgt-like proteins as deduced from sequenced L. pneumophila genomes. Lpg1368, Lpl1319, Lpp1322, and Lpc_0784 represent the Lgt1 group, Lpg2862 represents the Lgt2 group, and Lpg1488, Lpl1540, Lpp1444, and Lpc_0903 represent the Lgt3 group proteins. Amino acid residues that are similar among at least two different Lgt groups are darkened. A putative DXD motif is indicated above the corresponding line. The region of repeats in Lgt3 group proteins is marked by italics. A repeat unit (octapeptide KXEEEQRI) is underlined in lpg1488. The fragment of toxin B of C. difficile (GenBank accession number X53138) encompassing the DXD motif (the region of highest similarity to the corresponding L. pneumophila proteins) is shown in bold.
FIG. 2.
FIG. 2.
Guide tree demonstrating similarities among Lgt-like proteins. Coding numbers for the corresponding sequences (in italics) are shown according to L. pneumophila genome database nomenclature.
FIG. 3.
FIG. 3.
(a) SDS-PAGE analysis of purified preparations of GST-tagged Lgt1, Lgt2, Lgt3, and DT-A (lanes 1, 2, 3, and 4, respectively). Approximately 2 μg of each purified protein was loaded onto the gel, separated by electrophoresis, and stained with Coomassie R-250. Molecular masses of proteins, in kilodaltons, are shown on the left (K). (b to d) Enzymatic activities of Lgt1, Lgt2, and Lgt3. Purified GST-tagged L. pneumophila proteins were tested in a [14C]glucosyltransferase assay. After SDS gel electrophoresis, gels were dried and scanned on a phosphorimager. (b) Lane 1, Lgt1 without eukaryotic substrate; lane 2, Lgt2 without eukaryotic substrate; lane 3, Lgt3 without eukaryotic substrate; lane 4, EBL cell extract without L. pneumophila proteins; lane 5, Lgt1 plus EBL cell extract; lane 6, Lgt2 plus EBL cell extract; lane 7, Lgt3 plus EBL cell extract. Similar results were obtained with Caco2 and HeLa cell extracts (not shown). (c) Lane 1, Lgt1 plus eEF1A1; lane 2, Lgt1 plus eEF1A1 with S53A mutation; lane 3, Lgt1 plus eEF1A1 with S53T mutation; lane 4, Lgt2 plus eEF1A1; lane 5, Lgt2 plus eEF1A1 with S53A mutation; lane 6, Lgt2 plus eEF1A1 with S53T mutation; lane 7, Lgt3 plus eEF1A1; lane 8, Lgt3 plus eEF1A1 with S53A mutation; lane 9, Lgt3 plus eEF1A1 with S53T mutation. (d) EBL cell extracts, nontreated (lane 1; NT) or treated previously with “cold” UDP-glucose and wild-type (WT; lanes 2 to 4) or doubly mutated (Mut; lanes 5 to 7) Lgt1, were reglucosylated with UDP-[14C]glucose and Lgt1 (lanes 1, 2, and 5), Lgt2 (lanes 3 and 6), or Lgt3 (lanes 4 and 7). Molecular masses of modified eEF1A molecules (∼50 kDa for native protein and ∼80 kDa for GST-tagged protein) are shown on the right, in kilodaltons (K). Note the strong automodification of Lgt2 (panel b, lanes 2 and 6, and panel c, lanes 4 to 6).
FIG. 4.
FIG. 4.
Cytotoxic activity of L. pneumophila glucosyltransferases and DT-A. EBL cells were electroporated without added protein or in the presence of fully active GST-Lgt1, GST-Lgt2, GST-Lgt3, or GST-DT-A or inactive GST-Lgt1mut at 40 μg/ml. (a) Microscopic pictures of electroporated cells taken after 24 h, 48 h, and 72 h of incubation. (b) Microscopic pictures of cells taken after 24 h (enlarged view). (c) Counts of live cells (means [n = 3] and standard deviations). Electroporation without added protein is represented by empty circles, that with Lgt1mut is represented by empty triangles, that with DT-A is represented by filled circles, and that with Lgt3 is represented by filled triangles. Patterns of intoxication with Lgt1 and Lgt2 were very similar to that with Lgt3 and therefore are not shown in panel c.
FIG. 5.
FIG. 5.
Inhibition of protein synthesis by L. pneumophila glucosyltransferases and DT-A. (a) Inhibition of in vitro transcription/translation. Transcription/translation reactions were performed in the presence of recombinant GST-Lgt1, GST-Lgt2, GST-Lgt3, or GST-DT-A. After SDS gel electrophoresis, gels were dried and scanned on a phosphorimager. Concentrations of used proteins, given in μg per ml, are indicated on the top. The matrix DNA represents a luciferase gene-containing plasmid coding for an ∼60-kDa luciferase. Very similar results were obtained with a β-actin-encoding plasmid (not shown). NT, concentration was not tested. (b) Inhibition of in vivo [35S]methionine incorporation. EBL cells were electroporated with GST-Lgt1, GST-Lgt2, GST-Lgt3, or GST-DT-A (black columns) in methionine-free MEM. Concentrations in each series were 30 ng/ml and 0.3, 3.0, and 30 μg/ml, shown below the x axis. Two hours following intoxication, cells were pulsed with 0.5 μCi of [35S]methionine for 3 h, lysed, and assayed for incorporation of radioactivity into proteins (means [n = 3] and standard deviations). In control experiments (columns C), cells were electroporated either without Legionella proteins (white column) or with the double D246N/D248N Lgt1 mutant at 30 μg/ml (gray column).
FIG. 6.
FIG. 6.
Analysis of glucosyltransferase production by L. pneumophila Philadelphia-1. (a) An ultrasonic extract of L. pneumophila strain Philadelphia-1, grown on BCYE agar for 48 h, or corresponding purified glucosyltransferases were subjected to SDS gel electrophoresis, transferred to a nitrocellulose membrane, and probed with anti-Lgt1 (lanes 1 and 2), anti-Lgt2 (lanes 3 and 4), and anti-Lgt3 (lanes 5 and 6) sera. Lanes 1, 3, and 5 contained purified GST-Lgt1, GST-Lgt2, and GST-Lgt3, respectively (100 ng per lane). Lanes 2, 4, and 6 contained a crude extract of L. pneumophila (extract; 40 μg per lane). (b) Ultrasonic extracts of L. pneumophila strain Philadelphia-1, grown in BPPB for 3, 6, 12, 24, 36, and 48 h, were processed with sera against Lgt1, Lgt2, Lgt3, and RalF (a type IV secretion system effector protein) or subjected to glucosylation assay with UDP-[14C]glucose for 10 min at 37°C, using EBL cell extract as a substrate (panel 14C). A time point characterized by the appearance of a dark-brown pigment (characteristic of late stationary phase) is shown on the plot. Molecular masses of the corresponding bands are indicated on the right. OD660, optical density at 660 nm. (c) RNAs obtained from L. pneumophila Philadelphia-1 cells at 6, 12, 24, 36, and 48 h were subjected to RT-PCR in order to estimate levels of lgt1 (white columns) and lgt3 (black columns) transcription. Induction ratios, calculated as proportions of mRNA levels at certain time points to that at the time point with the minimal value (12 h for lgt1 and 36 h for lgt3), are shown.
FIG. 7.
FIG. 7.
Analysis of glucosyltransferase production by L. pneumophila Paris grown in proteose-peptone-based medium. (a) Ultrasonic extracts of L. pneumophila strain Paris, grown in BPPB for 3, 6, 10, 12, 24, 36, and 48 h, were processed with sera against Lgt1 and Lgt3 as described above or subjected to glucosylation assay with UDP-[14C]glucose for 10 min at 37°C, using EBL cell extract as a substrate (panel 14C). A representative bacterial growth curve is shown at the top. A time point characterized by the appearance of a dark-brown pigment (characteristic of late stationary phase) is shown on the plot. Molecular masses are indicated on the right. OD660, optical density at 660 nm. (b) Ultrasonic extracts of L. pneumophila strain Paris, cultivated in ACES-K buffer alone (A) or in BPPB (B) for 1, 2, 3, and 4 h, were processed with sera against Lgt1 and Lgt3. Molecular masses of the corresponding bands are indicated on the right.
FIG. 8.
FIG. 8.
Expression of lgt1 and lgt3 during L. pneumophila infection of A. castellanii. Amoeba cells, infected at a multiplicity of infection of 0.1 with agar-grown L. pneumophila Philadelphia-1 at 0 h, were cultivated for different time periods, lysed, and sampled for RT-PCR with primers specific for lgt1 (white columns) and lgt3 (black columns) (a) or for plate counting (b). The corresponding induction ratios, calculated as proportions of mRNA levels at certain time points to that at the time point with the minimal value (24 h for both lgt1 and lgt3), are shown in panel a. Growth of L. pneumophila (b) is shown as changes in log CFU/ml over time. Cultures were extensively washed after 3, 24, and 48 h of incubation before being sampled in order to remove extracellular bacteria. Data obtained demonstrate induction of the genes (a) and changes in numbers (b), predominantly of intracellular bacteria. In contrast, the culture at 72 h was sampled without being washed. This was done due to decreasing numbers of attached amoebae. Therefore, data obtained at 0 h and 72 h demonstrate induction of the genes mainly in extracellular bacteria, which are starting to infect eukaryotes (0 h) or exiting amoebae (72 h). CFU numbers at these time points are shown by single filled circles in panel b. The figure represents data from three independent cell culture experiments.

References

    1. Aktories, K., and J. T. Barbieri. 2005. Bacterial cytotoxins: targeting eukaryotic switches. Nat. Rev. Microbiol. 3397-410. - PubMed
    1. Bachman, M. A., and M. S. Swanson. 2001. RpoS co-operates with other factors to induce Legionella pneumophila virulence in the stationary phase. Mol. Microbiol. 401201-1214. - PubMed
    1. Belyi, I., M. R. Popoff, and N. P. Cianciotto. 2003. Purification and characterization of a UDP-glucosyltransferase produced by Legionella pneumophila. Infect. Immun. 71181-186. - PMC - PubMed
    1. Belyi, Y., R. Niggeweg, B. Opitz, M. Vogelsgesang, S. Hippenstiel, M. Wilm, and K. Aktories. 2006. Legionella pneumophila glucosyltransferase inhibits host elongation factor 1A. Proc. Natl. Acad. Sci. USA 10316953-16958. - PMC - PubMed
    1. Bradford, M. M. 1976. A rapid and sensitive method for the quantitation of microgram quantities of protein utilizing the principle of protein-dye binding. Anal. Biochem. 72248-254. - PubMed

Publication types

MeSH terms

Associated data

LinkOut - more resources