. 2008 Feb 15;22(4):489-98.
doi: 10.1101/gad.1634608.

Allele-specific nuclear positioning of the monoallelically expressed astrocyte marker GFAP

Affiliations

Allele-specific nuclear positioning of the monoallelically expressed astrocyte marker GFAP

Takumi Takizawa et al. Genes Dev. .

Abstract

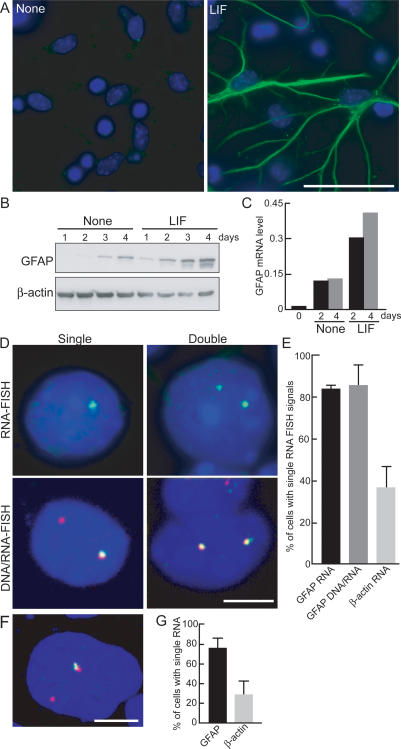
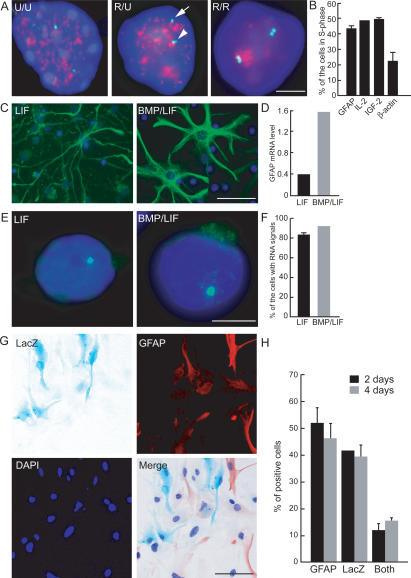
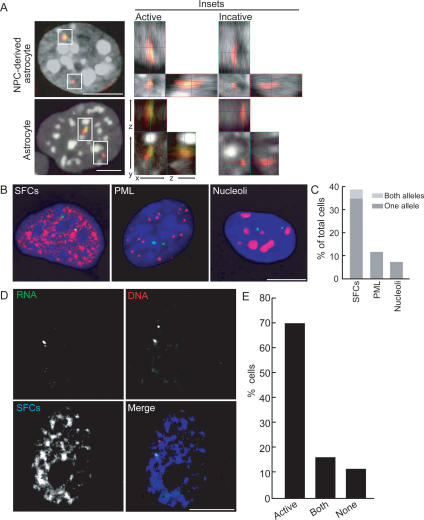
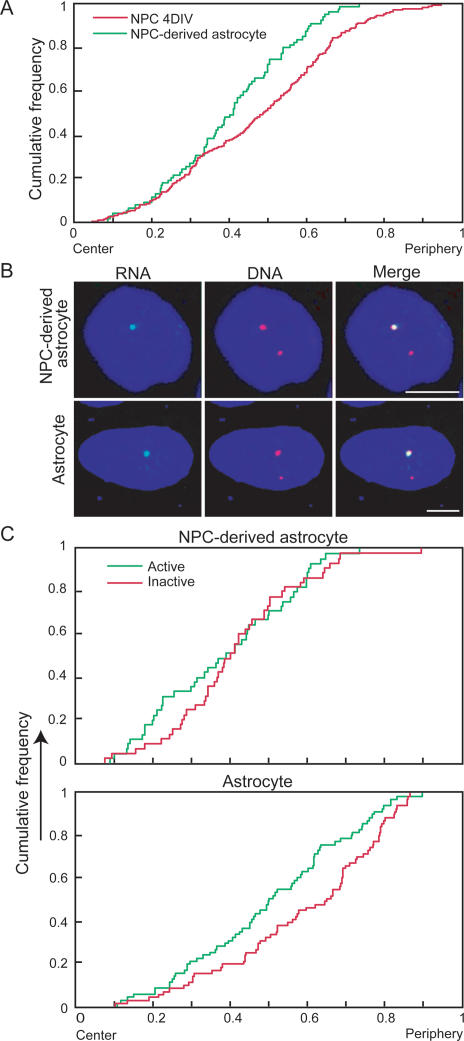
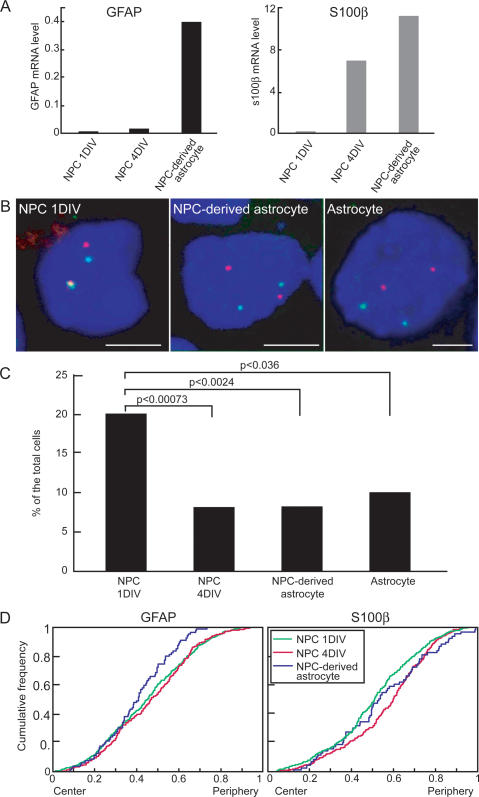
Chromosomes and genes are nonrandomly arranged within the mammalian cell nucleus. However, the functional significance of nuclear positioning in gene expression is unclear. Here we directly probed the relationship between nuclear positioning and gene activity by comparing the location of the active and inactive copies of a monoallelically expressed gene in single cell nuclei. We demonstrate that the astrocyte-specific marker GFAP (glial fibrillary acidic protein) is monoallelically expressed in cortical astrocytes. Selection of the active allele occurs in a stochastic manner and is generally maintained through cell division. Taking advantage of the monoallelic expression of GFAP, we show that the functionally distinct alleles occupy differential radial positions within the cell nucleus and differentially associate with intranuclear compartments. In addition, coordinately regulated astrocyte-specific genes on distinct chromosomes spatially associate in their inactive state and dissociate upon activation. These results provide direct evidence for function-related differential positioning of individual gene alleles within the interphase nucleus.


Figures

Figure 1.
Figure 1.
Monoallelic expression of GFAP. NPC prepared from E14 mice were treated with LIF for 4 d and stained with anti-GFAP antibody (green, GFAP; blue, DAPI) (A) and GFAP protein detected by Western blotting (B). (C) RT–PCR analysis of GFAP mRNA. mRNA was prepared from NPC incubated with or without LIF for 2 or 4 d and subjected to real-time quantitative PCR. GFAP mRNA levels were normalized to β-actin mRNA expression. (D) Monoallelic expression of GFAP. RNA FISH (top panels) or simultaneous DNA/RNA FISH (bottom panels) was performed in NPC treated with LIF. (Green) GFAP RNA; (red) GFAP DNA. (E) Quantitation of monoallelic expression of GFAP. The percentage of cells with a single RNA FISH signal is indicated. Values are averages from two to three experiments ± SEM. N = 41–127. (F) Expression of GFAP in astrocytes. Primary astrocytes were taken from neonatal mice cerebral cortex, and after two passages, simultaneous DNA/RNA FISH for GFAP was performed. (Red) GFAP DNA; (green) GFAP RNA. (G) Quantitation of active GFAP alleles in primary astrocytes. The percentage of cells with a single RNA FISH signal is indicated. Values are averages from three experiments ± SEM. N = 36–248. Bars: A, 50 μm; D,F, 5 μm.
Figure 2.
Figure 2.
Asynchronous replication timing and monoallelic expression of GFAP after stimulation. (A) Representative images of simultaneous GFAP DNA FISH and BrdU labeling. Astrocytes in S phase were labeled by BrdU 45 min before fixation in methanol/acetic acid. Immunostaining for BrdU was performed after DNA FISH. Arrow and arrowhead indicate the unreplicated and replicated loci, respectively. (Red) BrdU; (green) GFAP DNA; (U) unreplicated locus; (R) replicated locus. (B) Quantitation of replication patterns. The percentage of cells showing asynchronous replication (R/U) of the indicated gene loci in total S-phase cells was determined. DNA FISH for GFAP, IL-2, IGF-2, or β-actin was performed before BrdU staining. Values represent averages from two experiments ± SEM. N = 106–156. (CF) NPC prepared from E14.5 mice telencephalon were treated with LIF alone or BMP2 plus LIF (BMP/LIF). (C) Immunostaining for GFAP (green) after BMP/LIF stimulation. (D) Quantitative RT–PCR for GFAP mRNA after BMP/LIF stimulation. Data are normalized to β-actin mRNA. (E) GFAP RNA FISH. Monoallelic expression of GFAP mRNA (green) is maintained in BMP/LIF-stimulated cells. (F) Quantitation of cells with a single RNA FISH signal after BMP/LIF stimulation. N = 51–108. (G,H) Astrocytes from GFAP+/LacZ heterozygous mice. (G) X-gal assay and immunostaining for GFAP (red) in astrocytes from GFAP+/LacZ mice. (H) Quantitation of cells expressing LacZ gene product and/or GFAP in astrocytes from GFAP+/LacZ mice. Cells were cultured in the presence of BMP/LIF for 2 or 4 d. Values are averages from three experiments ± SEM. N = 230–937. Bars: A,E, 5 μm; C,G, 50 μm.
Figure 3.
Figure 3.
Relative positioning of GFAP alleles to nuclear bodies. (A) Positioning of GFAP loci relative to heterochromatin. Simultaneous DNA (red) and RNA (green) FISH for GFAP was performed, and confocal images were obtained. Heterochromatin was visualized by DAPI (white). Insets show 3D views of the active or inactive allele for each cell. The association of GFAP alleles with heterochromatin was probed by visual inspection of complete 3D reconstructions. (B,C) Relative positioning of GFAP loci to nuclear bodies. (B) Representative images of immunostaining (red) for SFCs, PML bodies, or nucleoli following DNA FISH for GFAP (green) in astrocytes. (C) Quantitation of percentage of cells with colocalization of GFAP loci to each nuclear body. Values are averages from three experiments for SFCs. N = 73–160. (D,E) Simultaneous DNA (red)/RNA (green) FISH for GFAP in astrocytes followed by immunostaining for SFCs. (E) Quantitation of the number of cells showing colocalization of GFAP active alleles, both active and inactive alleles, and no alleles with SFCs. N = 101. Bars, 5 μm.
Figure 4.
Figure 4.
Spatial nuclear positioning of GFAP alleles. (A) Cumulative distribution graphs of the radial position of GFAP alleles in NPC cultured for 4 d in vitro (4DIV) and NPC-derived astrocytes. N = 45, 138. (B) Representative images of NPC-derived astrocytes and primary astrocytes with only a single active GFAP allele. (Green) RNA; (red) DNA FISH. The active allele is preferentially internally located compared with the inactive allele. (C) Cumulative distribution graphs of the radial position of active and inactive alleles in NPC-derived astrocytes and primary astrocytes. N = 45, 72. Bars, 5 μm.
Figure 5.
Figure 5.
Relative positioning of GFAP and S100β in NPC during differentiation. (A) Quantitative RT–PCR of GFAP and S100β in NPC cultured for 1 or 4 d in vitro (DIV) and differentiated into astrocytes by LIF stimulation for another 4 d (NPC-derived astrocyte). Data are normalized to β-actin mRNA level. (B) Relative positioning of GFAP and S100β. Confocal images of DNA FISH for GFAP (red) and S100β (green). Relative distances between GFAP and S100β were determined for each focal plane. Bar, 5 μm. (C) Quantitation of percentage of cells showing close proximity of GFAP and S100β signals. N = 113–327. P values were obtained by a χ2 test. (D) Cumulative distribution graphs of the radial position of GFAP and S100β alleles in NPC cultured for 1 or 4 d and NPC-derived astrocytes. N = 45–245.

References

    1. Baxter J., Merkenschlager M., Fisher A.G. Nuclear organisation and gene expression. Curr. Opin. Cell Biol. 2002;14:372–376. - PubMed
    1. Bickmore W.A., Mahy N.L., Chambeyron S. Do higher-order chromatin structure and nuclear reorganization play a role in regulating Hox gene expression during development? Cold Spring Harb. Symp. Quant. Biol. 2004;69:251–257. - PubMed
    1. Castleman K.R. Digital image processing. Prentice Hall; Englewood Cliffs, NJ: 1996.
    1. Chakalova L., Debrand E., Mitchell J.A., Osborne C.S., Fraser P. Replication and transcription: Shaping the landscape of the genome. Nat. Rev. 2005;6:669–677. - PubMed
    1. Cremer T., Cremer C. Chromosome territories, nuclear architecture and gene regulation in mammalian cells. Nat. Rev. Genet. 2001;2:292–301. - PubMed

Publication types

LinkOut - more resources