. 2008 Feb;20(2):396-410.
doi: 10.1105/tpc.107.056846. Epub 2008 Feb 15.

The microtubule plus-end binding protein EB1 functions in root responses to touch and gravity signals in Arabidopsis

Affiliations

The microtubule plus-end binding protein EB1 functions in root responses to touch and gravity signals in Arabidopsis

Sherryl R Bisgrove et al. Plant Cell. 2008 Feb.

Abstract

Microtubules function in concert with associated proteins that modify microtubule behavior and/or transmit signals that effect changes in growth. To better understand how microtubules and their associated proteins influence growth, we analyzed one family of microtubule-associated proteins, the END BINDING1 (EB1) proteins, in Arabidopsis thaliana (EB1a, EB1b, and EB1c). We find that antibodies directed against EB1 proteins colocalize with microtubules in roots, an observation that confirms previous reports using EB1-GFP fusions. We also find that T-DNA insertion mutants with reduced expression from EB1 genes have roots that deviate toward the left on vertical or inclined plates. Mutant roots also exhibit extended horizontal growth before they bend downward after tracking around an obstacle or after a 90 degrees clockwise reorientation of the root. These observations suggest that leftward deviations in root growth may be the result of delayed responses to touch and/or gravity signals. Root lengths and widths are normal, indicating that the delay in bend formation is not due to changes in the overall rate of growth. In addition, the genotype with the most severe defects responds to low doses of microtubule inhibitors in a manner indistinguishable from the wild type, indicating that microtubule integrity is not a major contributor to the leftward deviations in mutant root growth.


Figures
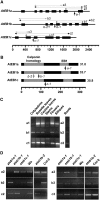
Figure 1.
Figure 1.
Expression Analysis of EB1 Genes. (A) EB1 genes, with introns designated as lines and exons as boxes. Horizontal arrows mark the positions of the PCR primers used in RT-PCR experiments (primers are not drawn to scale). Thin black arrows indicate the a1, b1, and c1 primer pairs, thick black arrows represent the a2, b2, and c2 primer pairs, and gray arrows represent a3, b3, and c3 primer pairs (corresponding to EB1a, EB1b, and EB1c, respectively). Scale is in nucleotides. (B) Predicted EB1 proteins contain conserved calponin homology and EB1 domains (gray boxes). Vertical arrows in (A) and (B) designate the sites of T-DNA insertions. Black arrows mark the insertion sites in plants from the Ws genetic background, while the gray arrow represents the insertion site of the eb1b-2 allele in the Col-0 background. (C) RT-PCR analyses using RNA from wild-type (Ws) plants indicate that EB1 genes are coexpressed in multiple plant organs. (D) RT-PCR analyses using RNA isolated from flowers indicate that full-length transcripts are undetectable in each homozygous eb1 mutant line (left panel). However, partial transcripts corresponding to sequences 5′ of the insertion site are detected (right panel). In (C) and (D), the PCR primer pairs used in each analysis are indicated to the left of the appropriate lanes.
Figure 2.
Figure 2.
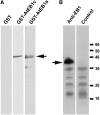
EB1 Antibodies Recognize Multiple EB1 Family Members. (A) Protein gel blot analysis of bacterially expressed GST, GST-EB1c, and GST-EB1a. (B) Protein gel blot analysis of wild-type plant extract with anti-EB1 and secondary antibody only (Control). The lower bands on the blot are due to nonspecific labeling of the secondary antibodies, since they are present on blots probed with secondary antibodies alone (Control lane). Arrows indicate the positions of major 35-kD bands corresponding to EB1 proteins.
Figure 3.
Figure 3.
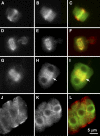
EB1 Proteins Colocalize with Microtubules in Meristematic Root Tip Cells. Root tip squashes double labeled with monoclonal antitubulin ([A], [D], [G], and [J]) and polyclonal anti-EB1 ([B], [E], [H], and [K]) imaged by epifluorescence microscopy. Merged images ([C], [F], [I], and [L]) are false colored with microtubules in red and EB1 in green. EB1 colocalizes with microtubules in the preprophase band ([A] to [C]), the mitotic spindle ([D] to [F]), and the phragmoplast ([G] to [I]). In an interphase cell with a radial array of microtubules, EB1 antibodies label the nuclear region and the cytoplasm in a punctuate pattern. Bar in (L) = 5 μM and applies to all cells.
Figure 4.
Figure 4.
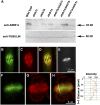
An Anti-EB1c-Enriched Pool of Antibodies Labels Microtubules in a Spindle and the Phragmoplast. (A) Protein gel blot analysis of extracts from mutant and wild-type plants probed with the anti-EB1c pool of antibodies (top panel). Labeling is reduced or absent in samples from seedlings carrying the eb1c-1 allele. Probing with anti-tubulin antibodies reveals that all lanes contain approximately equivalent amounts of protein (bottom panel). Arrows mark the positions of bands corresponding to At EB1c (∼35 kD) and tubulin (∼50 kD). (B) to (E) Labeling with EB1c antibodies is biased toward microtubule plus ends in a metaphase spindle from an Arabidopsis root tip cell and in a phragmoplast from an Arabidopsis suspension cell. Both cells were double-labeled with anti-EB1c–enriched antibodies ([B] and [F]) and anti-tubulin antibodies ([C] and [G]) and were imaged by confocal microscopy. The spindle was also labeled with 4′,6-diamidino-2-phenylindole to visualize chromosomes at the metaphase plate (E). Merged images ([D] and [H]) and single labels are false colored with EB1c in green and microtubules in red. Intensity scans across the phragmoplast (E) show that EB1c is concentrated toward the midzones, near the plus ends of microtubules. The white line marks the position of the intensity scan.
Figure 5.
Figure 5.
Roots of eb1 Mutants Skew toward the Left. On both vertically oriented ([A] to [H]) and inclined ([I] to [P]) agar plates, wild-type (Ws) roots grow down with a slight leftward deviation when viewed from above the agar surface ([A] and [I]). All eb1 genotypes exhibit leftward deviations in growth that are stronger than the wild type, eb1a-1 ([B] and [J]), eb1b-1 ([C] and [K]), eb1c-1 ([D] and [L]), eb1a-1/eb1b-1 ([E] and [M]), eb1a-1/eb1c-1 ([F] and [N]), eb1b-1/eb1c-1 ([G] and [O]), and eb1a-1/eb1b-1/eb1c-1 ([H] and [P]). The average angle at which roots deviated from the vertical direction (root skewing angle) was determined for each genotype on both vertically (open bars) and inclined (gray filled bars) agar plates (Q). Angles are reported in degrees, and confidence intervals (C.I.s) are calculated at P = 0.01. On vertically oriented plates, n = 186 (10 to 31 seedlings per genotype), and on inclined plates n = 316 (32 to 48 seedlings per genotype). Asterisks denote average angles that are significantly different from the wild type (P ≤ 0.01) by Student's t test.
Figure 6.
Figure 6.
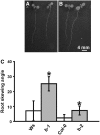
In the Col-0 Genetic Background, eb1b-2 Mutant Roots Also Deviate toward the Left. (A) and (B) When grown on inclined 0.8% agar plates, Col-0 roots (A) exhibit a slight deviation toward the left, and this leftward skewing is enhanced in the eb1b-2 allele (B). (C) The average root skewing angle was determined for the wild type (Ws and Col-0, open bars) as well as for eb1b-1 and eb1b-2 mutants (gray bars). Angles are reported in degrees, and C.I.s are calculated at P = 0.01. n = 79 (9 to 27 seedlings per genotype), and asterisks denote average angles that are significantly different from the wild type (P ≤ 0.01) by Student's t test.
Figure 7.
Figure 7.
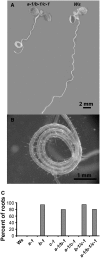
Mutant Roots Form Clockwise Oriented Loops and Coils on Inclined Plates with a High Concentration of Agar (1.6%). (A) A triple mutant has formed a clockwise coil (seedling on the left), while the wild-type seedling (right) has not. (B) Epidermal cell files in the coil of a triple mutant root are twisted into left-handed helices. (C) A representative experiment showing a percentage of cells forming loops and/or coils. Greater than 75% of roots homozygous for eb1b-1 formed loops and/or coils, while the same structures were not observed in the other genotypes. In this experiment, n = 160 (15 to 23 seedlings per genotype). Although the proportions of roots that form loops varies between experiments, eb1b mutants always form loops at much higher frequencies than the other genotypes.
Figure 8.
Figure 8.
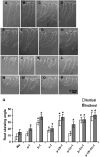
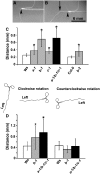
Analysis of Bend Formation in Roots Navigating around a Barrier or after a 90° Reorientation of the Root Tip. (A) and (B) Wild-type roots (A) track across the barrier and at the edge they immediately bend down. eb1b-1 mutants (B) continue to grow horizontally beyond the edge of the barrier. Arrowheads in denote the edge of the cover slip, and the arrow in (B) indicates the position of the downward gravitropic bend. (C) The average distance between the edge of the cover slip and downward curvature was calculated for each genotype. n = 306 (18 to 88 seedlings per genotype). (D) eb1 roots exhibit delays in bend formation when seedlings are rotated clockwise but not when they are rotated counterclockwise. The average distance between the position of the root tip at the time of rotation and the subsequent downward curvature was determined for each genotype. For clockwise rotations, n = 39 (10 to 15 roots per genotype), and for counterclockwise rotations n = 36 (10 to 16 roots per genotype). The asterisk and the “X” denote average angles that are significantly different from the wild type by Student's t test (P ≤ 0.01 and ≤ 0.05, respectively). Open bars denote wild-type plants (either Ws or Col-0), gray bars indicate single eb1 mutants, and black bars represent triple mutants. C.I.s are reported at P = 0.01.
Figure 9.
Figure 9.
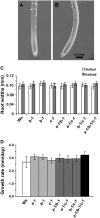
Root Elongation and Morphology Is Not Altered in eb1 Mutants. (A) and (B) Wild-type (A) and triple mutant (B) root tips are morphologically similar. (C) Average root widths, measured at the base of the elongation zone where root hair emergence begins, are similar for all genotypes, regardless of whether they are grown on vertically oriented (white bars) or inclined (gray bars) agar plates. The asterisk indicates a slight, but significant (P < 0.01 by Student's t test), difference between eb1c-1 and the wild type. On vertically oriented plates, n = 217 (19 to 39 seedlings per genotype), and on inclined plates n = 239 (27 to 33 seedlings per genotype). (D) When grown on vertically oriented plates, the elongation rate of mutants did not deviate significantly from the wild type (white bar), although mutant roots grew at slighter faster rates. Light-gray bars denote single eb1 mutants, dark-gray bars indicate double mutants, and the triple mutant is shown in black. n = 238 (16 to 40 seedlings measured per genotype). Widths are reported in millimeters, elongation rates in millimeters/day, and C.I.s are calculated at P = 0.01.
Figure 10.
Figure 10.
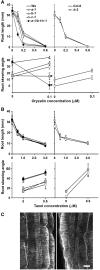
Microtubule Integrity in eb1 Roots. (A) and (B) Several eb1 genotypes were germinated on agar plates containing different concentrations of oryzalin (A) or taxol (B). On the third day, the position of the root tip was marked and the seedlings were allowed to continue growth for a total of 7 d, at which time root skewing angles and the amount of growth between day 3 and day 7 were measured. For all genotypes tested, root growth decreased with increasing concentrations of oryzalin or taxol (top panels in [A] and [B]), although eb1c-1 and triple mutants were more sensitive to oryzalin than were the other genotypes. Low concentrations of oryzalin or taxol in the medium (0.1 and 0.5 μM, respectively) increased root skewing angles in all genotypes except eb1c-1 and the triple mutant (bottom panels in [A] and [B]). Open circles denote wild-type plants (either Ws or Col-0), gray symbols indicate single mutants, and black circles designate triple mutants. (C) Microtubules, visualized by immunofluorescence and confocal microscopy, in triple mutant (left panel) and Ws root cells (right panel) are similar in appearance.

Similar articles

Cited by

References

    1. Abe, T., and Hashimoto, T. (2005). Altered microtubule dynamics by expression of modified α-tubulin protein causes right-handed helical growth in transgenic Arabidopsis plants. Plant J. 43 191–204. - PubMed
    1. Alonso, J.M., et al. (2003). Genome-wide insertional mutagenesis of Arabidopsis thaliana. Science 301 653–657. - PubMed
    1. Berrueta, L., Kraeft, S.-K., Tirnauer, J.S., Schuyler, S.C., Chen, L.B., Hill, D.E., Pellman, D., and Bierer, B.E. (1998). The adenomatous polyposis coli-binding protein EB1 is associated with cytoplasmic and spindle microtubules. Proc. Natl. Acad. Sci. USA 95 10596–10601. - PMC - PubMed
    1. Bienz, M. (2001). Spindles cotton on to junctions, APC and EB1. Nat. Cell Biol. 3 E1–E3. - PubMed
    1. Bisgrove, S.R., Hable, W.E., and Kropf, D.L. (2004). +TIPs and microtubule regulation. The beginning of the plus end in plants. Plant Physiol. 136 3855–3863. - PMC - PubMed

Publication types

MeSH terms

Substances

Associated data