. 2008 Feb;20(2):277-91.
doi: 10.1105/tpc.106.049957. Epub 2008 Feb 15.

EMBRYONIC FLOWER1 participates in polycomb group-mediated AG gene silencing in Arabidopsis

Affiliations

EMBRYONIC FLOWER1 participates in polycomb group-mediated AG gene silencing in Arabidopsis

Myriam Calonje et al. Plant Cell. 2008 Feb.

Abstract

Polycomb group (PcG)-mediated gene silencing is a common developmental strategy used to maintain stably inherited repression of target genes and involves different protein complexes known as Polycomb-repressive complexes (PRCs). In animals, the two best-characterized PcG complexes are PRC1 and PRC2. In this report, we demonstrate that the plant-specific protein EMBRYONIC FLOWER1 (EMF1) functions in maintaining the repression of the flower homeotic gene AGAMOUS (AG) during vegetative development in Arabidopsis thaliana by acting in concert with the EMF2 complex, a putative equivalent of Drosophila melanogaster PRC2. We show that AG regulatory sequences are required for its ectopic expression in both emf1 and emf2 mutants and that EMF2 is required for trimethylation of histone 3 lysine 27 on the AG chromatin. We found that EMF1 interacts directly with AG and that this interaction depends on the presence of EMF2. Together with the finding of EMF1 interference with transcription in vitro, these results suggest that EMF1 enables transcriptional repression of AG after the action of the putative EMF2 complex. Our data indicate that EMF1 plays a PRC1-like role in the PcG-mediated floral repression mechanism.


Figures
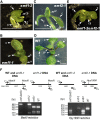
Figure 1.
Figure 1.
emf Mutant Phenotypes. (A) to (E) Phenotypic comparison among emf1-2 (A), emf1-1 (B), and emf2-1 (C) mutants, a wild-type plant (D), and emf1-2 emf2-1 double mutant (E) at 11 DAG. C, cotyledon; LP, leaf primordia; CS, carpeloid structures; H, hypocotyl; L, leaf. Bars = 2 mm. (F) Allele-specific RFLPs created by the emf1-2 and emf2-1 mutations. Top: the PCR fragments, the primers (P1, P2, P3, and P4 arrows), the restriction enzyme sites, and the predicted length (bp) of the fragments for each genotype (wild type, emf1-2, and emf2-1) are illustrated. Bottom: the left and right panels show the allele-specific RFLP analysis using restriction with MaeIII and Hpy188III, respectively. DNA size markers (bp) are identified at the left of each gel.
Figure 2.
Figure 2.
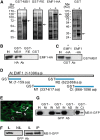
EMF1 Interacts with MSI1. (A) Coomassie blue stain of the SDS-PAGE gels loaded with GST-MSI1, GST-FIE, EMF1-HA, and GST E. coli extracts before (−) and after (+) induction with isopropyl-d-thiogalactopiranoside. Arrows indicate the induced proteins. (B) For GST pull-down assays, an equal volume of either GST-MSI1, GST-FIE, or GST bacterial extract was combined with EMF1-HA extract. Proteins were recovered using Glutathione-Sepharose beads and detected by protein gel blotting using an anti-HA antibody (HA Ab). IN corresponds to 10% of the EMF1-HA extract used in the GST pull downs. (C) EMF1-HA extract (+EMF1-HA) or noninduced E. coli extract (−EMF1-HA) was mixed with GST-MSI1 extract and immunoprecipitated with an anti-HA antibody. Precipitated proteins were detected by protein gel blotting using an anti-GST antibody (GST Ab). IN corresponds to 10% of the GST-MSI1 extract used in the immunoprecipitation. (D) Diagram depicts EMF1 protein fragments (Nt, M1, M2, or Ct) expressed as GST fusion proteins. aa, amino acids. (E) MSI1-GFP protein transiently expressed in N. benthamiana leaves showing a nuclear (N) and a cytoplasmic (C) localization probably due to its high expression level. (F) Detection of MSI1-GFP in infiltrated tobacco leaf (IL) compared with noninfiltrated tobacco leaf (NIL) and immunoprecipitation (IP) of MSI1-GFP from IL using GFP antibody. (G) Mapping of the interaction between EMF1 and MSI1-GFP. Antibodies (Ab) used for the protein gel blots are indicated in each panel.
Figure 3.
Figure 3.
GUS Staining Patterns in Wild-Type, emf2-6, and emf1-2 Mutant Plants Carrying AG:GUS Reporter Gene Constructs. The structures of the pMD200 (A), KB9R (B), and pMD222 (C) constructs are depicted in the top of the corresponding panels. Exons and introns are indicated by black boxes and open boxes, respectively. Dashed lines in (B) and (C) indicate a deletion in the pMD200 construct. Arrow indicates the 5′-to-3′ orientation of the fragment in (B). Where arrows are omitted, the fragments are in their normal 5′-to-3′ orientation. -60, minimal 35S promoter; P, PstI; X, XbaI; H, HindIII; Bg, BglII; S, SpeI; B, BamHI. Pictures in the bottom set of panels show the GUS activity in 4, 8, and 14 DAG wild-type plants and emf1-2 and emf2-6 mutants carrying pMD200, KB9R, or pMD222 construct, respectively. Bars = 2mm.
Figure 4.
Figure 4.
Expression of EMF1 Protein, Its Association with the Target Genes, and the Histone Methylation Pattern of the AG Gene. (A) Phenotype (top) and genotype (bottom) analysis of wild-type and RM plants. Allele-specific RFLPs created by the emf1-2 mutation (bottom panel). The PCR fragments, the restriction enzyme sites, and the predicted genomic and cDNA restriction fragments for each genotype are illustrated at the bottom left and middle. The RFLP analysis is shown at the bottom right. (B) Nuclear extracts from wild-type plants, RM, and emf2-2/EMF1-FLAG transgenic plants were subjected to protein gel blot analysis using monoclonal anti-FLAG antibody. Nuclear extracts were prepared from 4-, 14-, and 21-d-old seedlings grown on agar plates and from different plant organs: rosette leaves (RL), flower buds (FB), stems (St), and open flowers (F) from plants grown in soil. Ponceau red staining (bottom line) showing a 50-kD protein as a loading control. (C) Schematic representation of AP3, PI, and AG loci and AG 3′ flanking region. For AP3, PI, and AG, the exon/intron structure (black boxes/black lines, respectively), and for the AG downstream gene, the transcribed regions (white boxes) are depicted. The promoter regions of AP3, PI, and AG are also indicated (thick lines). The regions amplified by qRT-PCR are depicted as horizontal lines. (D) ChIP results expressed as percentage of input showing the association of EMF1 with the promoter of the target genes and AG 2nd intron. AG downstream region (down-AG) and ACTIN amplifications were used as negative controls. (E) ChIP results showing the AG H3-K27me3 pattern in wild-type seedlings, emf1-2, and emf2-2 mutants. In all the ChIP experiments the average IP from two chromatin samples is expressed on graphs as percentage of corresponding input DNA with error bars representing the standard deviations. Mock represents the chromatin immunoprecipitation without the Ab, and IP represents the chromatin immunoprecipitation with the Ab.
Figure 5.
Figure 5.
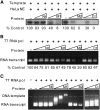
DNA and RNA Binding Activity of EMF1. (A) Protein gel blots probed with DNA. Noninduced E. coli extract (lane 1) and E. coli expressing GST-MSI1 extract (lane 2), used as controls, and E. coli expressing EMF1-HA extracts (lane 3) were resolved by SDS-PAGE, transferred to an Immobilon-P membrane, renatured, and finally incubated with a radiolabeled DNA probe. (B) Purified GST fusion proteins of EMF1 fragments: GST-Nt, GST-M1, GST-M2, and GST-Ct (see Figure 2D for constructs). (C) to (F) Different concentrations of EMF1 protein fragments (0, 20, and 40 nM of GST-Nt, GST-M2, and GST-Ct and 0, 20, 40, and 60 nM of GST-M1) were incubated with a 250-bp NOS terminator DNA PCR fragment (double-stranded DNA [dsDNA]), a 100-base oligonucleotide (single-stranded DNA [ssDNA]), or a 100-nucleotide RNA transcript (RNA) for 30 min at 4°C. Samples were loaded in a 1% agarose gel and stained with ethidium bromide.
Figure 6.
Figure 6.
Inhibition of in Vitro Transcription by EMF1. (A) For the RNA polymerase II transcription assays, a restriction fragment containing the CMV immediate early gene promoter was transcribed in vitro, and the radiolabeled runoff transcript was resolved on a 6% denaturing polyacrylamide gel. Reaction mixtures contained 100 ng of DNA template, 0, 20, or 40 nM of the different EMF1 protein fragments (see Figure 2D), and HeLa nuclear extract (NE). Quantitations of the transcript are relative to the “” protein lane. (B) T7 RNA polymerase transcription reactions contained 100 ng of linearized pGEM DNA template, 0, 20, 40, or 60 nM of EMF1 protein fragment, and T7 RNA polymerase. Products were visualized on denaturing 1% agarose gels. Quantitations of the transcript are relative to the “” protein lane. (C) T7 RNA polymerase assays following the same conditions as in (B) but visualizing the products in a native 1% agarose gel. All these experiments were reproduced at least three times obtaining in all repetitions a similar amount of transcript relative to the control.
Figure 7.
Figure 7.
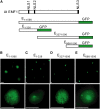
Subcellular Localization of EMF1-GFP Fusion Proteins in N. benthamiana Leaves. (A) Schematic representations of EMF1 and truncated EMF1 proteins fused to GFP. (B) to (E) Nuclear localization of EMF1 full-length and protein fragments. Top and bottom panels show images of nuclei containing each construct using a lower magnification (top panels) or higher magnification (bottom panels) to demonstrate that all the nuclei displayed the specific expression pattern. All these experiments were reproduced at least three times. NLS, nuclear localization signal. Bars = 10 μm.

Similar articles

Cited by

References

    1. Alvarez-Venegas, R., Pien, S., Sadder, M., Witmer, X., Grossniklaus, U., and Avramova, Z. (2003). ATX-1, an Arabidopsis homolog of trithorax, activates flower homeotic genes. Curr. Biol. 13 627–637. - PubMed
    1. Aubert, D., Chen, L., Moon, Y.H., Martin, D., Castle, L.A., Yang, C.H., and Sung, Z.R. (2001). EMF1, a novel protein involved in the control of shoot architecture and flowering in Arabidopsis. Plant Cell 13 1865–1875. - PMC - PubMed
    1. Bastow, R., Mylne, J.S., Lister, C., Lippman, Z., Martienssen, R.A., and Dean, C. (2004). Vernalization requires epigenetic silencing of FLC by histone methylation. Nature 427 164–167. - PubMed
    1. Boss, P.K., Bastow, R.M., Mylne, J.S., and Dean, C. (2004). Multiple pathways in the decision to flower: Enabling, promoting, and resetting. Plant Cell 16(Suppl): S18–S31. - PMC - PubMed
    1. Bowler, C., Benvenuto, G., Laflamme, P., Molino, D., Probst, A.V., Tariq, M., and Paszkowski, J. (2004). Chromatin techniques for plant cells. Plant J. 39 776–789. - PubMed

Publication types