. 2008 Jun;49(6):2773-80.
doi: 10.1167/iovs.07-1335. Epub 2008 Feb 15.

Real-time in vivo imaging of retinal cell apoptosis after laser exposure

Affiliations

Real-time in vivo imaging of retinal cell apoptosis after laser exposure

Steffen Schmitz-Valckenberg et al. Invest Ophthalmol Vis Sci. 2008 Jun.

Abstract

Purpose: To investigate whether the detection of apoptosing retinal cells (DARC) could detect cells undergoing apoptosis in a laser model of retinal damage.

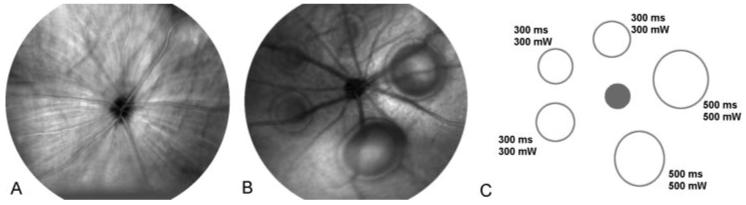
Methods: Laser lesions were placed, with the use of a frequency-doubled Nd:YAG laser, on the retina in 34 eyes of anesthetized Dark Agouti rats. Lesion size and laser-induced retinal elevation were analyzed using in vivo reflectance imaging. Development of retinal cell apoptosis was assessed using intravitreal fluorescence-labeled annexin 5 in vivo with DARC technology from baseline until 90 minutes after laser application. Histologic analysis of retinal flat mounts and cross-sections was performed.

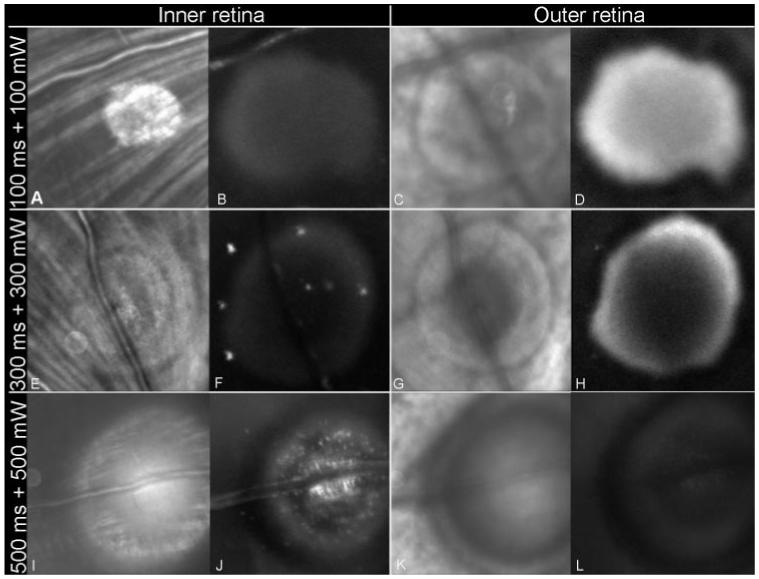
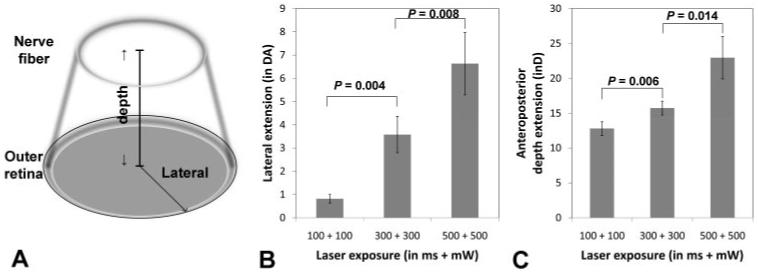
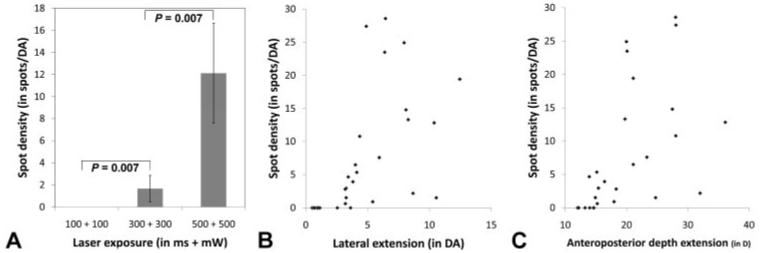
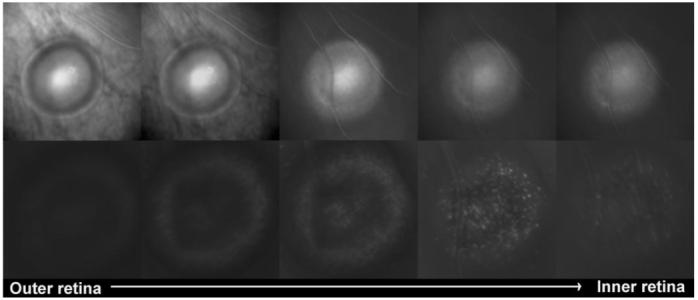
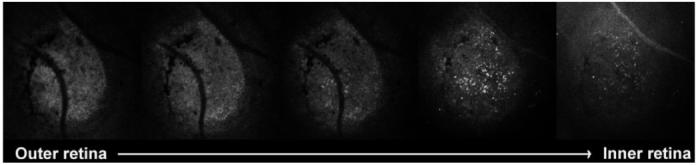
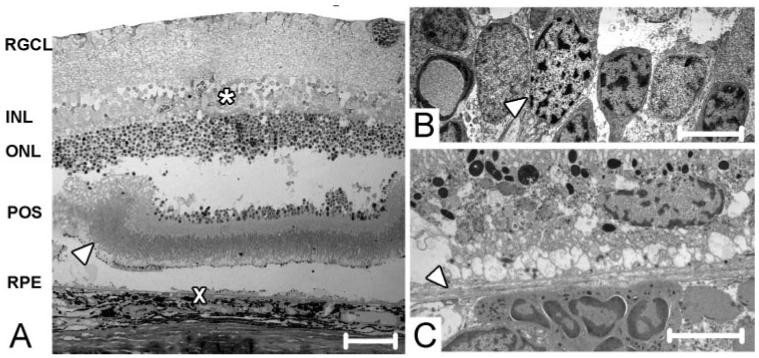
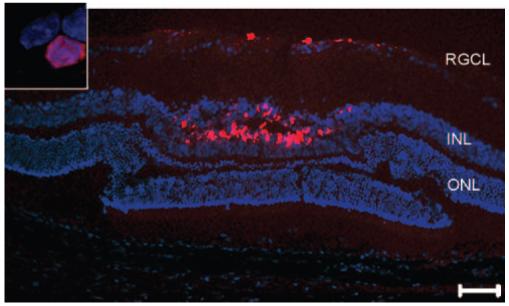
Results: The lateral and anteroposterior depth extension of the zone of laser damage was significantly larger for higher exposure settings. A strong diffuse signal, concentrated at the outer retina, was seen with DARC for low exposures (<300 ms and <300 mW). In comparison, higher exposures (>300 ms and >300 mW) resulted in detectable hyperfluorescent spots, mainly at the level of the inner retinal layers. Dose-dependent effects on spot density and positive correlation of spot density between lesion size (P < 0.0001) and retinal elevation (P < 0.0001) were demonstrated. Histology confirmed the presence of apoptosing retinal cells in the inner nuclear and the ganglion cell layers.

Conclusions: This is the first time that DARC has been used to determine apoptotic effects in the inner nuclear layer. The ability to monitor changes spatially and temporally in vivo promises to be a major advance in the real-time assessment of retinal diseases and treatment effects.


Figures

Figure 1
Figure 1
Placement of laser lesions in rat eye. (A) Baseline reflectance image before laser exposure is focused at the level of the nerve fiber layer. Normal central retina is visualized. (B) Five to six laser lesions were placed around the disc. Reflectance imaging immediately after laser exposure shows five laser burns. (C) Schematic drawing illustrates the different exposure settings. Note the larger lesion size and the marked development of a blister for the burns with higher exposures (B, C).
Figure 2
Figure 2
In vivo imaging on the effects of different levels of laser exposure. Reflectance imaging (confocal plane: A, E, I, inner retina; C, G, K, outer retina) shows that the size of the laser lesions is dose dependent and that the lateral extension of damage is larger at the outer retina. Fluorescence imaging (corresponding focal planes to the reflectance images: B, F, J, inner retina; D, H, L, outer retina) visualizes distribution and uptake of fluorescence-labeled annexin 5. Within the burn produced with the lowest settings (100 ms and 100 mW; A-D, top row), an intense diffuse hyperfluorescence is detected. Confocal imaging suggests that this signal is mainly derived from the outer retina (D). Laser intensities at 300 ms and 300 mW (E-H) produce diffuse hyperfluorescence at the edges of the lesion at the level of the outer retina (H) and a few spots inside and near the lesion at the level of in the inner retina (F). Increasing the power and exposure time (500 ms and 500 mW, I-L) reveals many hyperfluorescent spots, concentrated in the middle of the lesion, that are visualized in the presence of blister formation at the level of the inner retina (J).
Figure 3
Figure 3
Spatial assessment of retinal damage and the effects of different levels of laser exposure. (A) The extent of laser damage was defined by two parameters. The lateral extension was assessed at the level of the outer retina, where it was measured in DA. The relative anteroposterior depth extension was quantified by the differences in diopter units between scans of the inner retina and outer retina. (B, C) A dose-dependent correlation of the spatial extension of the zone of damage was observed. The lesion size area for the group with low-energy settings (100 ms and 100 mW) was always less than 1 DA, and no significant retinal elevation compared with baseline was detectable (P = 0.52). Laser lesions produced with higher settings (300 ms and 300 mW) were significantly larger (P = 0.004) and showed increased retinal thickness (P = 0.006). Blister formation with even more lateral (P = 0.008) and anteroposterior depth (P = 0.014) extension of damage was seen for the highest settings (500 ms and 500 mW).
Figure 4
Figure 4
Assessment of retinal cell apoptosis for different laser exposures in vivo. (A) No retinal cell apoptosis inside the laser burn was observed for 100 mW and 100 ms. For the other two energy groups, the density of spots per DA (number of spots per disc area) was significantly higher in the 500 ms and 500 mW group than in the 300 ms and 300 mW group (see also Fig. 2). (B, C) For each lesion, both the lateral and the anteroposterior extension of damage were plotted against the spot density. The two graphs show a positive correlation for higher spot density in lesions with larger lesion size and with more pronounced retinal elevation. These findings were statistically significant (Spearman rank coefficient; each P < 0.0001).
Figure 5
Figure 5
In vivo analysis of blister lesion. This sequence of five reflectance images (upper line) with corresponding fluorescence (lower line) images illustrates sectional scans through a laser blister (500 ms and 500 mW). Scanning from the outer retina (far left) toward the vitreous to the anterior part of the lesion (far right), the reflectance mode reveals a circular, well-demarcated zone of damage with surrounding edema. The fluorescence mode shows mild intensity at the outer retina, whereas hyperfluorescent spots are imaged at the more inner retinal layers. The density of these spots appears to be highest at the inner retina, at the level below the ganglion cell layers and most probably at the inner nuclear layer.
Figure 6
Figure 6
Confocal histologic analysis of whole retina. Confocal histologic analysis of whole retina of a blister lesion (exposure settings: 500 ms and 500 mW) reveals massive destruction and loss of anatomic details with mildly diffuse hyperfluorescence at the outer retina. Hyperfluorescent spots are visualized at the level of the inner retina. The number of spots is highest in the middle of the lesion and at the inner nuclear layer. Markedly fewer spots are seen at the ganglion cell layers. These results were consistent with the in vivo imaging analysis.
Figure 7
Figure 7
Morphologic cross-sectional analysis with light and electron microscopy. Representative cross-sections through laser lesion (500 ms and 500 mW) with light and transmission electron microscopy. (A) Semithin section (3 μm in thickness) through the laser burn reveals the formation of a blister. Elevation of the photoreceptor outer segments (POS), separation of the outer nuclear layer (ONL), and disruption of the inner nuclear layer (INL) are observed. No pronounced damage is visible at the level of the retinal ganglion cell (RGCL). At the edge of the burn (far left, arrowhead), folding of the photoreceptor outer segment layer is present. Scale bar, 50 μm. (B) Electron transmission microscopy photographs (×2500; *approximate location) show structural changes consistent with apoptosis, including pyknotic nuclei (arrowhead) with abnormal distribution of heterochromatin, local swelling of the cytoplasm, and organelle loss in the INL. (C) Electron microscopy (x) shows disruption and vacuolization at the retinal pigment epithelium and choriocapillaris level. Bruch membrane (arrowhead) appears to be intact.
Figure 8
Figure 8
Cross-sectional analysis of retinal apoptosis. Cryostat cross-sectioning through a histologic laser lesion (energy setting: 500 ms and 500 mW) and overlay with DAPI allows for localization of annexin 5-positive spots mainly at the inner nuclear layer (INL) (blue, DAPI; red, fluorescence-labeled annexin 5). Few spots are present at the ganglion cell layer (RGCL). High magnification of the inner nuclear layers (inset) shows colocalization of annexin 5-positive spots (red) with cell nuclei (blue). Scale bar, 50 μm.

Similar articles

Cited by

References

    1. Webb RH, Hughes GW, Delori FC. Confocal scanning laser ophthalmoscope. Appl Optics. 1987;26:1492–1499. - PubMed
    1. von Ruckmann A, Fitzke FW, Bird AC. Distribution of fundus autofluorescence with a scanning laser ophthalmoscope. Br J Ophthalmol. 1995;79:407–412. - PMC - PubMed
    1. Cordeiro MF, Guo L, Luong V, et al. Real-time imaging of single nerve cell apoptosis in retinal neurodegeneration. Proc Natl Acad Sci U S A. 2004;101:13352–13356. - PMC - PubMed
    1. Guo L, Salt TE, Luong V, et al. Targeting amyloid-β in glaucoma treatment. Proc Natl Acad Sci U S A. 2007;104:13444–13449. - PMC - PubMed
    1. Guo L, Salt TE, Maass A, et al. Assessment of neuroprotective effects of glutamate modulation on glaucoma-related retinal ganglion cell apoptosis in vivo. Invest Ophthalmol Vis Sci. 2006;47:626–633. - PMC - PubMed

Publication types