. 2008 May;49(5):1137-46.
doi: 10.1194/jlr.D700041-JLR200. Epub 2008 Feb 16.

Lipid extraction by methyl-tert-butyl ether for high-throughput lipidomics

Affiliations

Lipid extraction by methyl-tert-butyl ether for high-throughput lipidomics

Vitali Matyash et al. J Lipid Res. 2008 May.

Abstract

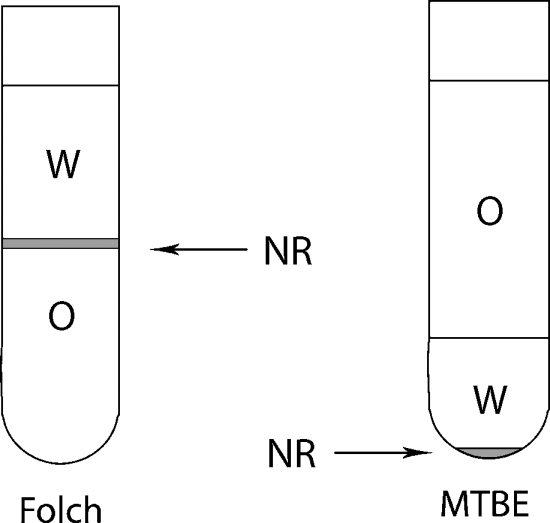
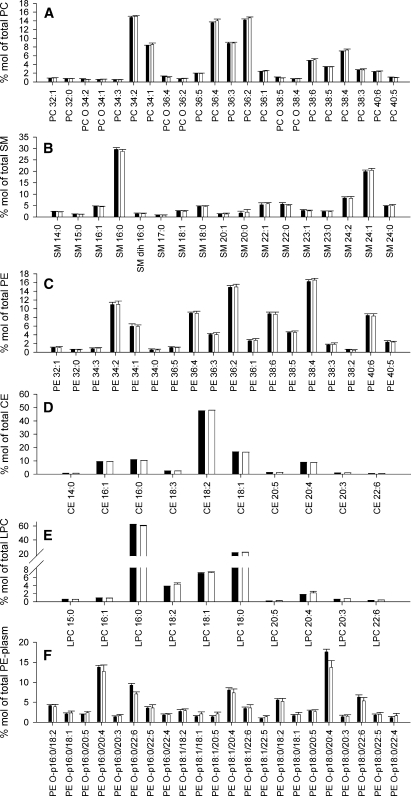
Accurate profiling of lipidomes relies upon the quantitative and unbiased recovery of lipid species from analyzed cells, fluids, or tissues and is usually achieved by two-phase extraction with chloroform. We demonstrated that methyl-tert-butyl ether (MTBE) extraction allows faster and cleaner lipid recovery and is well suited for automated shotgun profiling. Because of MTBE's low density, lipid-containing organic phase forms the upper layer during phase separation, which simplifies its collection and minimizes dripping losses. Nonextractable matrix forms a dense pellet at the bottom of the extraction tube and is easily removed by centrifugation. Rigorous testing demonstrated that the MTBE protocol delivers similar or better recoveries of species of most all major lipid classes compared with the "gold-standard" Folch or Bligh and Dyer recipes.


Figures

Fig. 1.
Fig. 1.
Methyl-tert-butyl ether (MTBE) lipid extraction method. Phase distribution in the MTBE and Folch methods. NR, insoluble (protein) residue; O, organic phase; W, water phase.
Fig. 2.
Fig. 2.
Glycerophospholipids from E. coli recovered by Folch and MTBE extraction. A: Time-of-flight (TOF)-MS spectrum of the Folch lipid extract. B: TOF MS spectrum of the MTBE lipid extract. C: Phosphatidylethanolamine (PE) profiles of Folch-extracted (black bars) and MTBE-extracted (white bars) lipids; intensities were normalized to the sum of all PE species (means ± SD; n = 6). D: Phosphatidylglycerol (PG) lipid profiles, with notations as in C.
Fig. 3.
Fig. 3.
Comparison of the lipid composition of mouse brain tissue obtained by Folch and MTBE lipid extraction protocols. A, B: Positive ion mode survey scans of the Folch and MTBE lipid extracts. C: Normalized profiles of phosphatidylcholine (PC) and sphingomyelin (SM) species. D: Normalized profiles of PE species in Folch and MTBE extracts. E: Normalized profiles of PE-plasmalogen species. F: Normalized profile of phosphatidylserine (PS) species. G: Profiles of hexosylceramides (HexCer). Folch extract is designated with black bars, and MTBE extract is designated with white bars (means ± SD; n = 6).
Fig. 4.
Fig. 4.
Glycerophospholipids of C. elegans embryos recovered by Folch and MTBE protocols. A, B: Positive ion mode survey scans of the Folch and MTBE lipid extracts. C: Normalized profiles of PC lipid species. D: Profiles of PE lipid species. E: Normalized profiles of PE-plasmalogen lipid species. F: Normalized profiles of PS lipid species. Folch extract is designated with black bars, and MTBE extract is designated with white bars (means ± SD; n = 6).
Fig. 5.
Fig. 5.
Comparison of major lipid components of human plasma obtained by Bligh and Dyer or MTBE automated lipid extraction protocols. A: PC lipid species profile normalized to total PC content. B: SM lipid species profile normalized to total SM content. C: PE lipid species profile normalized to total PE content. D: Cholesteryl ester (CE) lipid species profile normalized to total CE content. E: Lysophosphatidylcholine (LPC) lipid species profile normalized to total LPC content. F: PE-plasmalogen profile normalized to total PE-plasmalogen content. Profiles are displayed in mol% for lipid extracts obtained by the Bligh and Dyer or MTBE protocol. All species at >0.5 mol% are displayed. Bligh and Dyer extract is designated with black bars, and MTBE extract is designated with white bars (means ± SD; n = 10).

References

    1. Han X., and R. W. Gross. 2005. Shotgun lipidomics: multidimensional MS analysis of cellular lipidomes. Expert Rev. Proteomics. 2 253–264. - PubMed
    1. Wenk M. R. 2005. The emerging field of lipidomics. Nat. Rev. Drug Discov. 4 594–610. - PubMed
    1. Piomelli D., G. Astarita, and R. Rapaka. 2007. A neuroscientist's guide to lipidomics. Nat. Rev. Neurosci. 8 743–754. - PubMed
    1. van Meer G. 2005. Cellular lipidomics. EMBO J. 24 3159–3165. - PMC - PubMed
    1. Yetukuri L., M. Katajamaa, G. Medina-Gomez, T. Seppanen-Laakso, A. Vidal-Puig, and M. Oresic. 2007. Bioinformatics strategies for lipidomics analysis: characterization of obesity related hepatic steatosis. BMC Syst Biol. 1 12–26. - PMC - PubMed

Publication types

LinkOut - more resources