. 2008 Feb 8;4(2):e45.
doi: 10.1371/journal.ppat.0040045.

Iron source preference and regulation of iron uptake in Cryptococcus neoformans

Affiliations

Iron source preference and regulation of iron uptake in Cryptococcus neoformans

Won Hee Jung et al. PLoS Pathog. .

Abstract

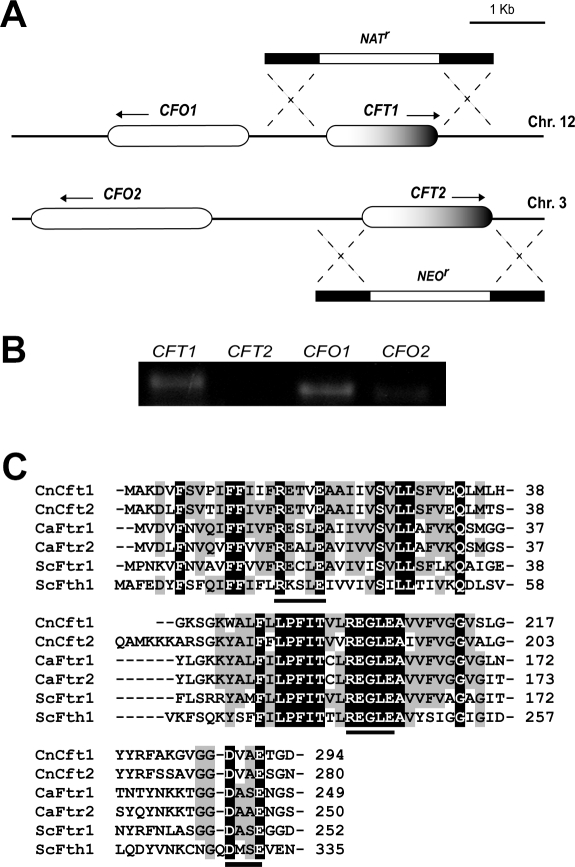
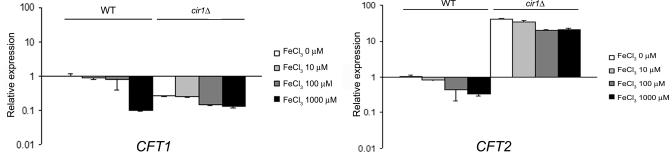
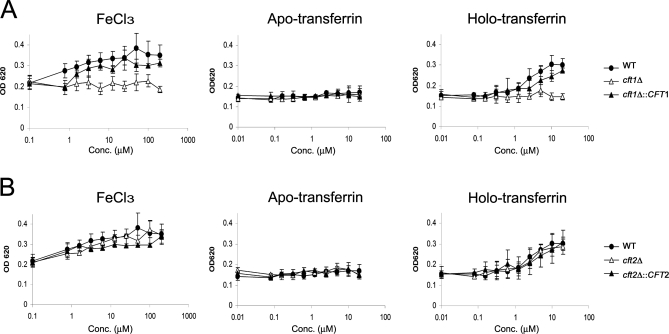
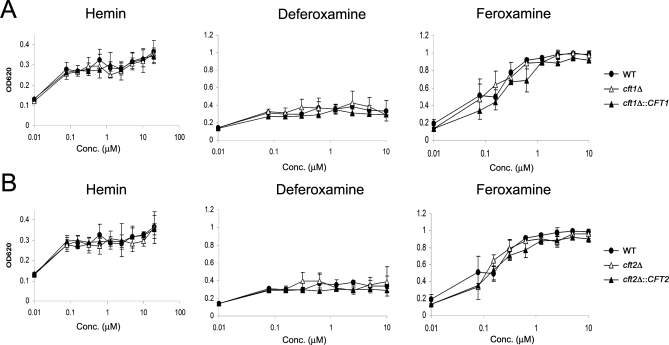
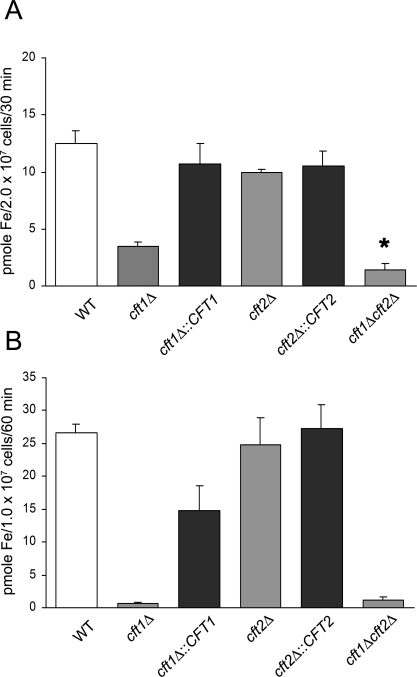
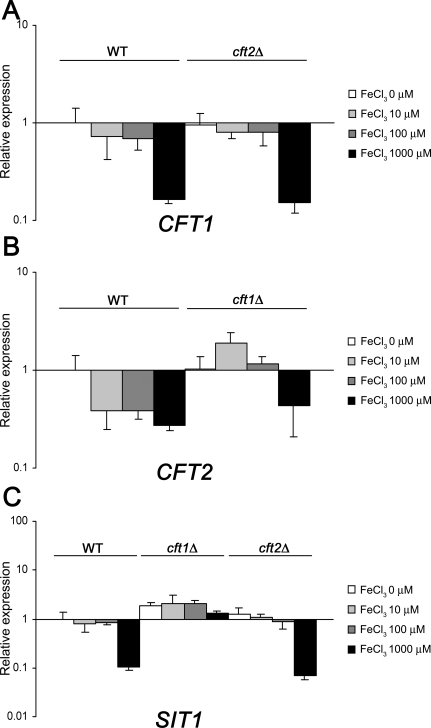
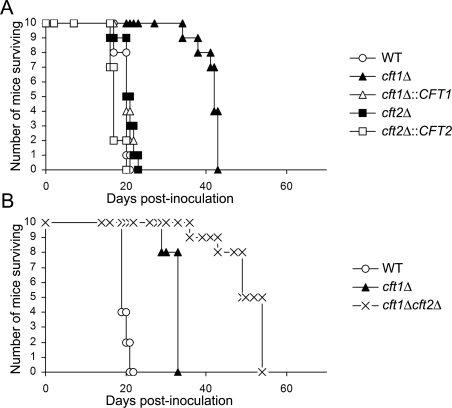
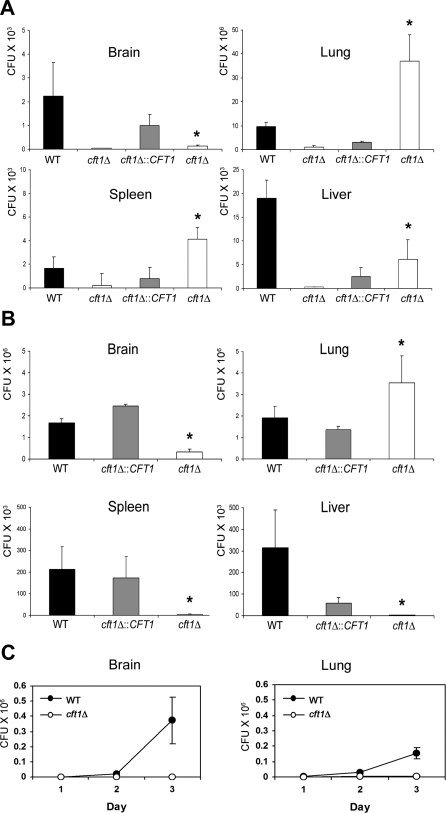
The level of available iron in the mammalian host is extremely low, and pathogenic microbes must compete with host proteins such as transferrin for iron. Iron regulation of gene expression, including genes encoding iron uptake functions and virulence factors, is critical for the pathogenesis of the fungus Cryptococcus neoformans. In this study, we characterized the roles of the CFT1 and CFT2 genes that encode C. neoformans orthologs of the Saccharomyces cerevisiae high-affinity iron permease FTR1. Deletion of CFT1 reduced growth and iron uptake with ferric chloride and holo-transferrin as the in vitro iron sources, and the cft1 mutant was attenuated for virulence in a mouse model of infection. A reduction in the fungal burden in the brains of mice infected with the cft1 mutant was observed, thus suggesting a requirement for reductive iron acquisition during cryptococcal meningitis. CFT2 played no apparent role in iron acquisition but did influence virulence. The expression of both CFT1 and CFT2 was influenced by cAMP-dependent protein kinase, and the iron-regulatory transcription factor Cir1 positively regulated CFT1 and negatively regulated CFT2. Overall, these results indicate that C. neoformans utilizes iron sources within the host (e.g., holo-transferrin) that require Cft1 and a reductive iron uptake system.


Conflict of interest statement

Competing interests. The authors have declared that no competing interests exist.

Figures

Figure 1
Figure 1. Genomic Arrangement and Conserved Regions of CFT1 and CFT2
(A) CFT1 and CFT2 are located on chromosomes 12 and 3, respectively. The genes were disrupted by transforming the disruption cassette containing the selectable marker for resistance to nourseothricin (NAT r) or neomycin (NEO r) as shown. (B) Basal levels of the transcripts are shown for the genes indicated above the lanes. The cells were grown under low-iron conditions and transcripts were amplified by RT-PCR (30 cycles). (C) Comparison of specific regions of the predicted amino acid sequences of Cft1 and Cft2 with the high-affinity iron permeases in other fungi. Both Cft1 and Cft2 contain the highly conserved motifs underlined. CnCft1: C. neoformans Cft1 from strain H99; CnCft2: C. neoformans Cft2 from strain H99; CaFtr1: C. albicans CaFtr1 (AAF69680); CaFtr2: C. albicans CaFtr2 (AAF69681); ScFtr1: S. cerevisiae Ftr1 (NP_011072); ScFth1: S. cerevisiae Fth1 (CAA85171).
Figure 2
Figure 2. Expression of CFT1 and CFT2 Is Iron Dependent and Differentially Regulated by Cir1
Transcriptional regulation of CFT1 and CFT2 in the wild-type strain and the cir1 mutant was monitored by quantitative real-time RT-PCR after growing cells in medium containing various concentrations of iron (0, 10, 100 and 1,000 μM of FeCl3). Data were normalized by using ACT1 as an internal control and are presented as relative expression. Data are from four replicates and bars represent the standard deviations.
Figure 3
Figure 3. CFT1 Is Required for Reductive Iron Uptake
(A) Iron-starved strains (the wild-type, the cft1 mutant and the CFT1 reconstituted strain) were inoculated into media containing FeCl3, apo-transferrin or holo-transferrin, which were added in stepwise 2-fold dilutions. The actual range of concentrations in the cultures was between 200 μM and 0.78 μM of FeCl3, and 20 μM and 0.078 μM of apo- or holo-transferrin. The OD620 reading at 0.1 μM in FeCl3 containing plates and 0.01 μM in Apo- or Holo-transferrin containing plates represent the level of growth in media without an added iron source, starting at the standard inoculum density of 0.08. All cultures were incubated at 30°C and turbidity was measured after 72 h. The averages of three independent experiments are presented with bars representing the standard deviations. (B) The same experiments as shown in (A) were performed for the cft2 mutant and all strains showed similar patterns of growth.
Figure 4
Figure 4. Non-Reductive Iron Uptake Systems Are Independent of Cft1 and Cft2
(A) Iron-starved strains (the wild-type, the cft1 mutant and the CFT1 reconstituted strain) were inoculated into media containing heme, deferoxamine and feroxamine, which were added in stepwise 2-fold dilutions. The range of concentrations was between 20 μM and 0.78 μM (heme) and between 10 μM and 0.78 μM (deferoxamine and feroxamine); note that the scale on the X-axis is between 0.01 and 10 or 100 μM. In each graph, the OD620 reading at 0.01 μM indicates the level of growth in media without an added iron source starting at the standard inoculum density of 0.08. All cultures were incubated at 30°C and turbidity was measured after 72 h. Averages of three independent experiments are presented with bars representing the standard deviations. (B) The same experiments as shown in (A) were performed for the cft2 mutant and all strains showed similar patterns of growth.
Figure 5
Figure 5. Iron Uptake Is Impaired in the cft1 Mutant
(A) Strains were grown in defined low-iron medium and analyzed for iron uptake with 55FeCl3. The results show the average from three experiments with bars representing the standard deviations. The asterisk (*) indicates that the iron uptake for the cft1 cft2 double mutant was statistically different from that of the cft1 mutants (p = 0.007 by a Student t test). (B) The strains indicated were grown in low-iron medium and uptake of 55Fe from transferrin was measured. The results shown are an average from three experiments with bars representing the standard deviations.
Figure 6
Figure 6. CFT1 Influences Transcript Levels for CFT2 and the Siderophore Transporter Gene SIT1
(A) Transcriptional regulation of CFT1 in the cft2 mutant was monitored by quantitative real-time RT-PCR after growing cells in media containing different concentrations of iron (0, 10, 100 and 1,000 μM of FeCl3). (B) Transcriptional regulation of CFT2 in the cft1 mutant was monitored by quantitative real-time RT-PCR in the same culture conditions. (C) Transcription of SIT1 was analyzed in both the cft1 and the cft2 mutant strains in parallel experiments. All data were normalized by using ACT1 as an internal control, according to the ΔΔCt method, and are presented as fold changes (y-axis). Data are from four replicates and bars represent the standard deviations.
Figure 7
Figure 7. The Expression of CFT1 and CFT2 Are Regulated by Components of the cAMP-Dependent Protein Kinase
Strains lacking PKA1, PKA2 or PKR1 were grown in media containing different concentrations of iron (0, 10, 100 and 1,000 μM of FeCl3), and transcript levels of CFT1 (A) or CFT2 (B) were compared by quantitative real-time RT-PCR. Data were normalized by using ACT1 as an internal control, according to the ΔΔCt method, and presented as relative expression. Data are from four replicates and bars represent the standard deviations.
Figure 8
Figure 8. Deletion of CFT1 Increases Susceptibility to Antifungal Agents that Target Fungal Sterol Biosynthesis and Function
The growth of strains in media containing the antifungal drugs miconazole and amphotericin B was monitored to assess sensitivity. Ten-fold serial dilutions of cells (starting at 106 cells) were spotted onto YPD plates with and without the antifungal drug indicated. Plates were incubated at 30°C for two days.
Figure 9
Figure 9. The cft1 and cft1 cft2 Mutants Are Attenuated for Virulence
(A) Ten female A/Jcr mice were infected intranasally with each of the strains indicated and the survival of the mice was monitored over the time course indicated on the x-axis. The difference in survival between the cft1Δ mutant and the WT strain was significant based on a Kaplan-Meier survival analysis (p < 0.0001). (B) In a separate experiment, the virulence of the cft1Δ cft2Δ double mutant was compared with that of the WT strain and the cft1Δ mutant, again with 10 mice per inoculation. A second, independently isolated, double mutant showed a similar attenuation of virulence. All of the virulence tests were performed at least twice. The difference in survival between the cft1Δ mutant and the WT strain was significant (p < 0.0001), as was the difference between the cft1Δ mutant and the cft1Δ cft2Δ double mutant (p < 0.0001).
Figure 10
Figure 10. The cft1 Mutant Shows Reduced Tissue Colonization in a Mouse Model of Cryptococcosis
(A) Distribution of fungal cells in the organs of mice infected by the inhalation method. Organs from mice infected with the wild-type strain, the cft1 mutant or the CFT1 reconstituted strain were collected at day 19 when the wild type and the reconstituted strain reached the end point. Additionally, organs from mice infected with the cft1 mutants were collected at day 34 when mice reached the end point. Fungal burdens were monitored in organs by determining colony-forming units (CFU) upon plating on YPD medium. Three mice for each strain were used at each time point. Data are average CFUs per organ with standard deviations. CFUs for the cft1 mutant at day 34 are marked with an asterisk; the other counts are from day 19. (B) Distribution of fungal cells in mice infected by the tail vein injection method. Organs from mice infected with the wild-type strain or the CFT1 reconstituted strain were collected at day 7 when the wild type and the reconstituted strain reached the end point. Organs from mice infected with the cft1 mutants were collected at day 29 when mice reached the end point. Fungal burdens were monitored as described in (A). Three mice for each strain were used. Data are averages with standard deviations. CFUs for the cft1 mutants at day 29 are marked with an asterisk; the other counts are from day 7. (C) The ability of the cft1 mutant to colonize brain and lung tissue was compared with the wild-type strain. Mice were inoculated with 2.5 × 10⁵ cells by tail vein injection, sacrificed at the times indicated and analyzed for fungal burden.

Similar articles

Cited by

References

    1. Bullen JJ, Rogers HJ, Spalding PB, Ward CG. Natural resistance, iron and infection: A challenge for clinical medicine. J Med Microbiol. 2006;55:251–258. - PubMed
    1. Weinberg ED. Iron and susceptibility to infectious disease. Science. 1974;184:952–956. - PubMed
    1. Baveye S, Elass E, Mazurier J, Spik G, Legrand D. Lactoferrin: A multifunctional glycoprotein involved in the modulation of the inflammatory process. Clin Chem Lab Med. 1999;37:281–286. - PubMed
    1. Wandersman C, Delepelaire P. Bacterial iron sources: From siderophores to hemophores. Annu Rev Microbiol. 2004;58:611–647. - PubMed
    1. Skaar EP, Humayun M, Bae T, DeBord KL, Schneewind O. Iron-source preference of Staphylococcus aureus infections. Science. 2004;305:1626–1628. - PubMed

Publication types