. 2008 Feb 25;180(4):665-72.
doi: 10.1083/jcb.200712029. Epub 2008 Feb 18.

Examining the link between chromosomal instability and aneuploidy in human cells

Affiliations

Examining the link between chromosomal instability and aneuploidy in human cells

Sarah L Thompson et al. J Cell Biol. .

Abstract

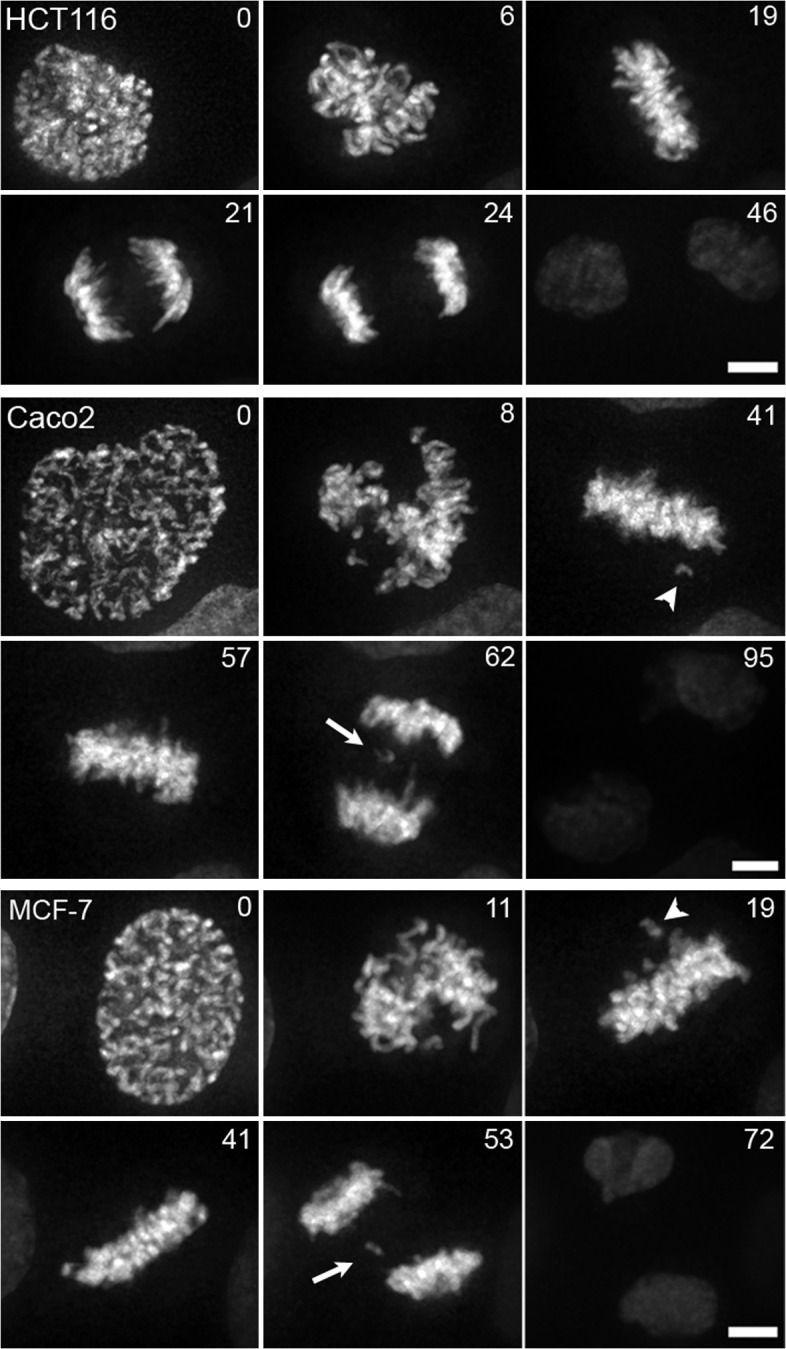
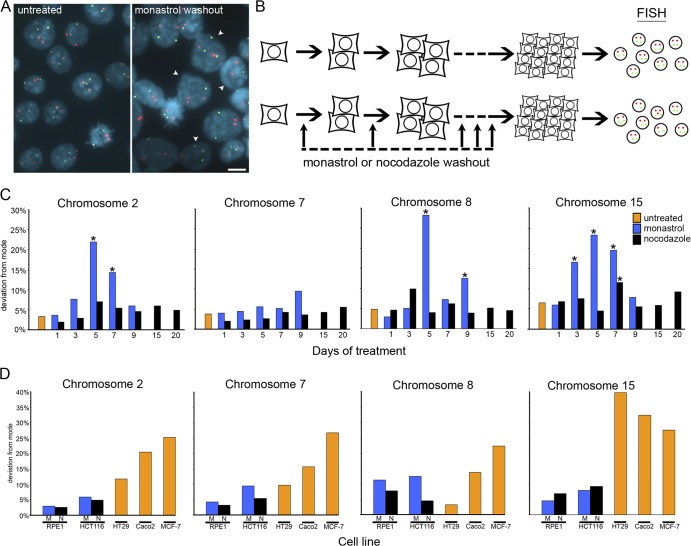
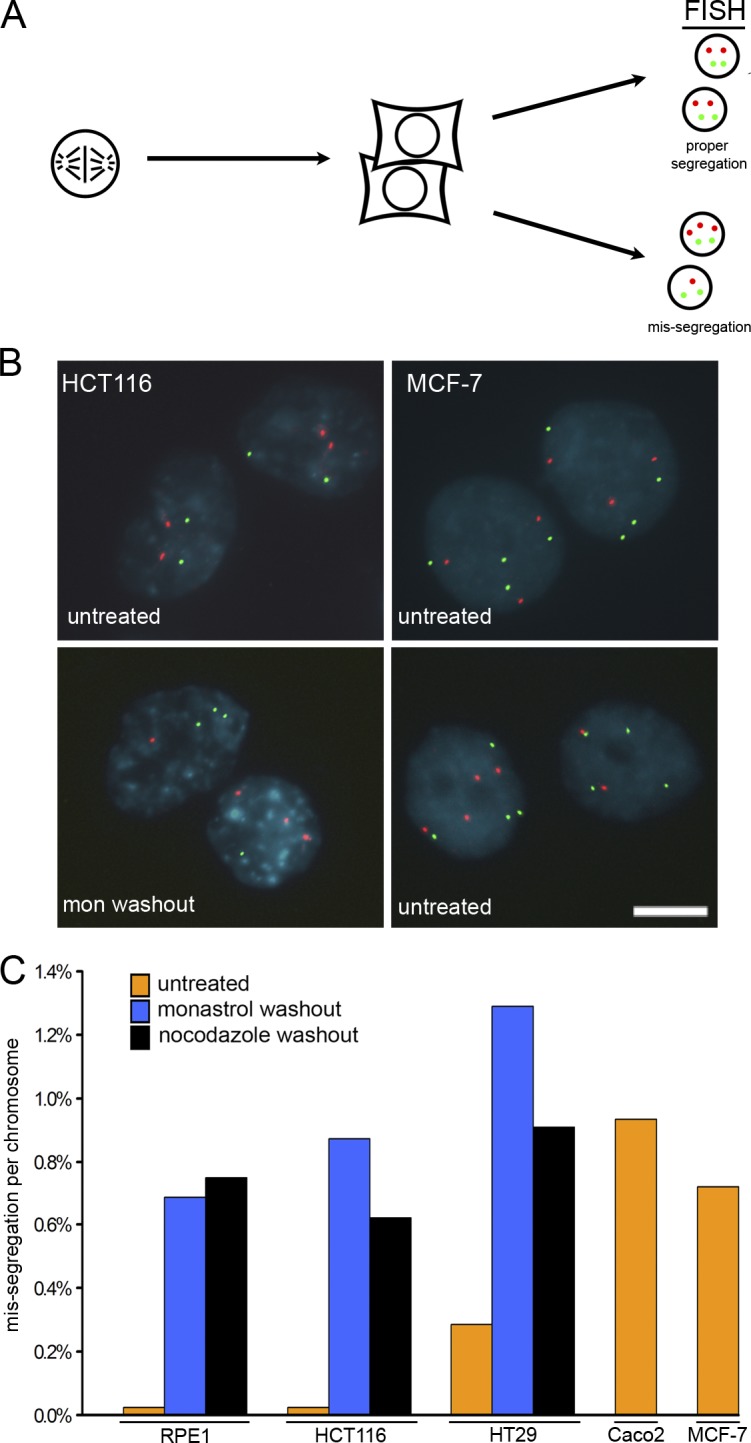
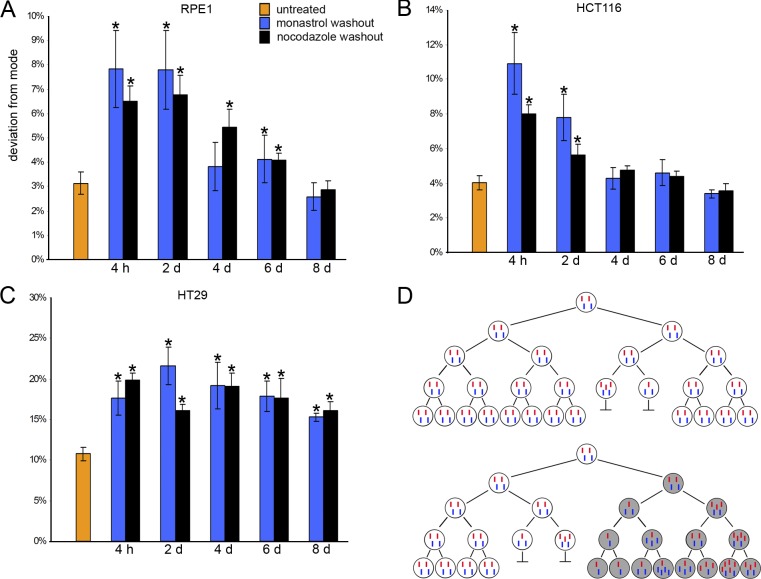
Solid tumors can be highly aneuploid and many display high rates of chromosome missegregation in a phenomenon called chromosomal instability (CIN). In principle, aneuploidy is the consequence of CIN, but the relationship between CIN and aneuploidy has not been clearly defined. In this study, we use live cell imaging and clonal cell analyses to evaluate the fidelity of chromosome segregation in chromosomally stable and unstable human cells. We show that improper microtubule-chromosome attachment (merotely) is a cause of chromosome missegregation in unstable cells and that increasing chromosome missegregation rates by elevating merotely during consecutive mitoses generates CIN in otherwise stable, near-diploid cells. However, chromosome missegregation compromises the proliferation of diploid cells, indicating that phenotypic changes that permit the propagation of nondiploid cells must combine with elevated chromosome missegregation rates to generate aneuploid cells with CIN.


Figures

Figure 1.
Figure 1.
Chromosome segregation in human tumor cell lines.GFP–histone H2B was expressed in colon carcinoma HCT116 and Caco2 cells and in breast cancer MCF-7 cells. Images selected from time-lapse videos are shown with times given in minutes. Arrowheads identify unaligned chromosomes in prometaphase, and arrows identify lagging chromatids at anaphase. Bars, 5 μm.
Figure 2.
Figure 2.
CIN analyses.(A) Examples of FISH data from HCT116 colonies that were either untreated or subjected to recovery from monastrol-induced mitotic delay (monastrol washout) every third division during colony growth as indicated. Cells were fixed and stained with DAPI (blue) to visualize nuclei and with probes specific for centromeric α-satellite DNA of chromosomes 7 (green) and 8 (red). Arrowheads identify nuclei in which one or both chromosomes deviate from the modal number of two. Bar, 20 μm. (B) Cells were isolated by mitotic shake-off, plated at low density, and grown for several generations to form individual colonies with (bottom) or without (top) recovery from monastrol or nocodazole treatment sequentially for various numbers of cell divisions during colony growth. After ∼30 generations, cells were harvested, and interphase nuclei were labeled with centromere-specific FISH probes. (C) Percentage of nuclei that display deviation from the modal chromosome number of two for four different chromosomes in representative single colonies of HCT116 cell clones that were untreated or subjected to recovery from monastrol- or nocodazole-induced mitotic delay for various days during colony growth (data for all clones can be found in Table S2, available at http://www.jcb.org/cgi/content/full/jcb.200712029/DC1). *, P < 0.05, χ2 test. (D) Percentage of nuclei that display deviation from the modal chromosome number (chromosomal modes for each cell line are provided in Table S1) for four different chromosomes in representative single colonies in the untreated CIN cell lines HT29, Caco2, and MCF-7 (data for all clones can be found in Table S4); RPE-1 cells subjected to recovery from monastrol- or nocodazole-induced mitotic delay for 25 consecutive days (data for all clones can be found in Table S3); or HCT116 cells subjected to recovery from monastrol-induced mitotic delay for nine consecutive days or nocodazole-induced mitotic delay for 20 consecutive days (data for all clones can be found in Table S2).
Figure 3.
Figure 3.
Chromosome missegregation analysis. (A) Mitotic cells were harvested by mitotic shake-off, plated at low density on slides, and allowed to complete mitosis. Daughter cells were fixed and stained with DAPI (blue) to visualize nuclei and with probes specific to centromeric α-satellite DNA (FISH). (B) FISH for chromosomes 7 and 8 are shown for HCT116 and MCF-7 cells and show normal segregation (top) and missegregation (bottom). Bar, 10 μm. (C) Mean missegregation rate per chromosome for no fewer than two chromosomes in RPE-1 cells (untreated, n = 4,300; monastrol recovery, n = 2,620; nocodazole recovery, n = 2,602), HCT116 cells (untreated, n = 4,000; monastrol recovery, n = 2,640; nocodazole recovery, n = 2,660), HT29 cells (untreated, n = 2,680; monastrol recovery, n = 2,640; nocodazole recovery, n = 2,640), Caco2 cells (n = 1,023), and MCF-7 cells (n = 2,002) as indicated. Percentages have been corrected for modal chromosome number in each cell line (chromosomal modes for each cell line are provided in Table S1, available at http://www.jcb.org/cgi/content/full/jcb.200712029/DC1).
Figure 4.
Figure 4.
Chromosome deviations in cell populations. (A–C) RPE1 (A), HCT116 (B), and HT29 (C) cells were grown in flasks and were untreated or treated with monastrol or nocodazole. Mitotic cells were harvested by shake-off, washed to remove the mitotic inhibitor, and plated in growth medium to allow the completion of mitosis. Cells were then harvested for FISH analysis at the indicated times. Mean deviation from the mode for two different chromosomes in each of two independent experiments, with 600 nuclei counted per chromosome per time point and condition for each experiment. Error bars are SEM. *, P < 0.05, χ2 test. (D) Diploid cells showing two pairs of chromosomes (one red and one blue) that segregate faithfully during most mitoses. A chromosome missegregation event occurs, generating two nondiploid daughter cells that do not propagate efficiently, so the overall karyotype of the culture remains diploid (top). A phenotypic change (gray cells) arises either independently of chromosome missegregation (as shown) or coordinated with the missegregation that permits nondiploid cells to propagate (bottom). Chromosome missegregation subsequently generates aneuploid cells in this population as those cells continue to accrue abnormal chromosome numbers.

Comment in

  • The wages of CIN.
    Yuen KW, Desai A. Yuen KW, et al. J Cell Biol. 2008 Feb 25;180(4):661-3. doi: 10.1083/jcb.200801030. Epub 2008 Feb 18. J Cell Biol. 2008. PMID: 18283117 Free PMC article. Review.

References

    1. Cahill, D.P., C. Lengauer, J. Yu, G.J. Riggins, J.K. Wilson, S.D. Markowitz, K.W. Kinzler, and B. Vogelstein. 1998. Mutations of mitotic checkpoint genes in human cancers. Nature. 392:300–303. - PubMed
    1. Cimini, D., and F. Degrassi. 2005. Aneuploidy: a matter of bad connections. Trends Cell Biol. 15:442–451. - PubMed
    1. Cimini, D., C. Tanzarella, and F. Degrassi. 1999. Differences in malsegregation rates obtained by scoring ana-telophases or binucleate cells. Mutagenesis. 14:563–568. - PubMed
    1. Cimini, D., B. Howell, P. Maddox, A. Khodjakov, F. Degrassi, and E.D. Salmon. 2001. Merotelic kinetochore orientation is a major mechanism of aneuploidy in mitotic mammalian tissue cells. J. Cell Biol. 153:517–527. - PMC - PubMed
    1. Cimini, D., L.A. Cameron, and E.D. Salmon. 2004. Anaphase spindle mechanics prevent mis-segregation of merotelically oriented chromosomes. Curr. Biol. 14:2149–2155. - PubMed

Publication types

MeSH terms