. 2008 Mar 1;22(5):654-67.
doi: 10.1101/gad.451008. Epub 2008 Feb 18.

The longest telomeres: a general signature of adult stem cell compartments

Affiliations

The longest telomeres: a general signature of adult stem cell compartments

Ignacio Flores et al. Genes Dev. .

Abstract

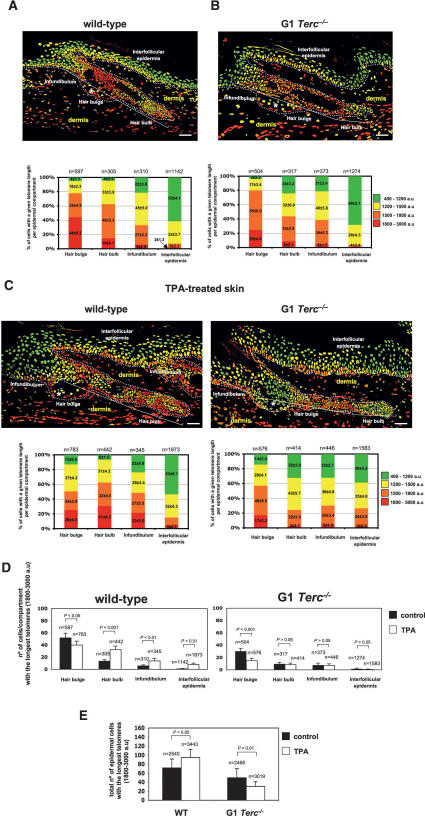
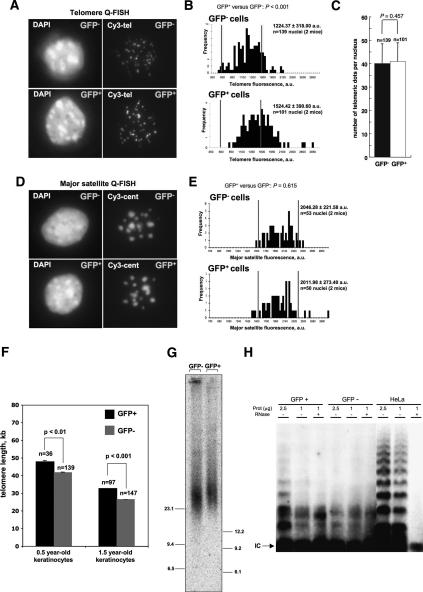
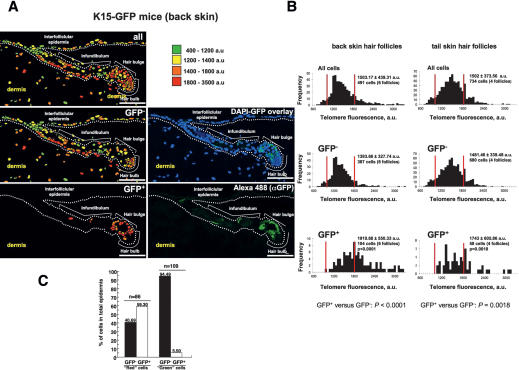
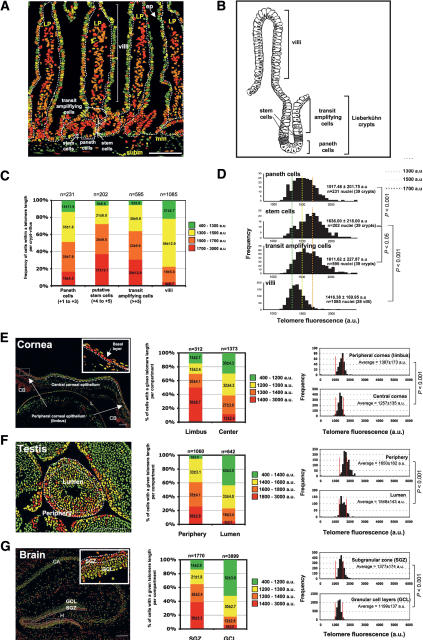
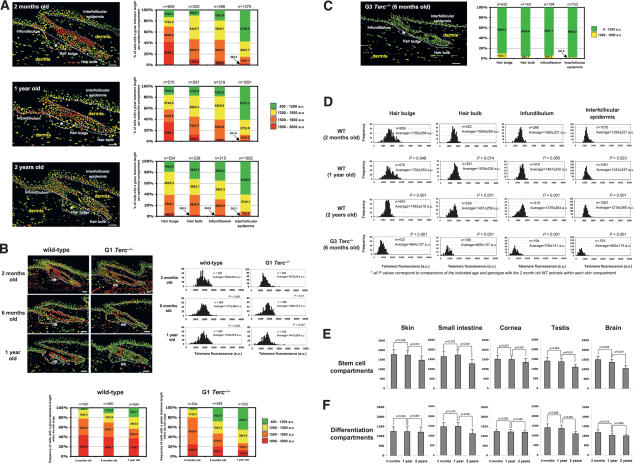
Identification of adult stem cells and their location (niches) is of great relevance for regenerative medicine. However, stem cell niches are still poorly defined in most adult tissues. Here, we show that the longest telomeres are a general feature of adult stem cell compartments. Using confocal telomere quantitative fluorescence in situ hybridization (telomapping), we find gradients of telomere length within tissues, with the longest telomeres mapping to the known stem cell compartments. In mouse hair follicles, we show that cells with the longest telomeres map to the known stem cell compartments, colocalize with stem cell markers, and behave as stem cells upon treatment with mitogenic stimuli. Using K15-EGFP reporter mice, which mark hair follicle stem cells, we show that GFP-positive cells have the longest telomeres. The stem cell compartments in small intestine, testis, cornea, and brain of the mouse are also enriched in cells with the longest telomeres. This constitutes the description of a novel general property of adult stem cell compartments. Finally, we make the novel finding that telomeres shorten with age in different mouse stem cell compartments, which parallels a decline in stem cell functionality, suggesting that telomere loss may contribute to stem cell dysfunction with age.


Figures

Figure 1.
Figure 1.
Cells with the longest telomeres are enriched at the hair follicle stem cell compartment and show stem cell behavior upon treatment with mitogenic stimuli. Representative telomere length pseudocolor images of “resting” wild-type (A) and G1 Terc−/− (B) tail skin. Nuclei are colored according to their average telomere fluorescence in arbitrary units. The different epidermal compartments are indicated and separated from the dermis by a dashed line. Asterisk indicates the sebaceous glands. Bars, 50 μm. Note the specific enrichment of cells with the longest telomeres at the hair bulge area in both wild-type and Terc−/− mice. Bottom panels show the percentage of cells showing a given telomere fluorescence within the indicated epidermal compartment. A total of three skin sections per mouse out of two mice per genotype were used for quantification of percentage of cells and standard deviation. (n) Total number of cells within the indicated compartment used for the analysis. (C) Upon TPA treatment, wild-type epidermal cells showing the longest telomeres (red color) localized not only to the hair bulge but also to the TA compartments (hair bulb and infundibulum). This enrichment of cell with long telomeres to the TA compartments was abolished in TPA-treated G1 Terc−/− skin. (D) Absolute number of cells showing an average telomere fluorescence between 1800 and 3000 a.u. per indicated skin compartment ± SD. A total of three skin sections per mouse out of a total of two mice per genotype were used for quantification of the number of cells per skin compartment and standard deviation. (n) Total number of cells of each compartment used for the analysis (six independent hair follicle images were counted). (E) Absolute total number of epidermal cells per skin section with telomere fluorescence between 1800 and 3000 a.u. ± SD. Note that TPA induces a net telomere elongation in wild-type epidermis, which is abolished in G1 Terc−/− skin. A total of six skin sections per genotype and condition were used for quantification purposes. (n) Total number of cells in the epidermis included for the analysis. Statistical significance is indicated on top of the bars.
Figure 2.
Figure 2.
Isolated hair bulge stem cells from K15-EGFP mice show the longest telomeres and telomerase activity. (A) Representative DAPI and Cy3 images of GFP+ and GFP FACS-sorted keratinocytes from K15-EGFP mice. (B) Q-FISH histograms showing telomere fluorescence frequencies. Average telomere fluorescence and SD are indicated. Differences in telomere length between GPF+ and GFP cells were highly significant (P < 0.001). (n) Number of nuclei used for the Q-FISH analysis from two independent K15-EGFP mice. The red lines highlight the increased frequency of long telomeres in GFP-positive cells. (C) Number of telomere spots per nuclei in sorted GFP+ and GFP cells indicates similar ploidy. (D) Representative DAPI and Cy3 centromeric images of GFP+ and GFP FACS-sorted keratinocytes from K15-EGFP mice. (E) Quantification of major satellite fluorescence signal in sorted GFP+ and GFP cells. No significant differences in centromere fluorescence were detected between both populations. Two independent mice were used for the analysis. (n) Total number of nuclei used for the analysis. (F) Average telomere length in kilobases of purified GFP-positive and GFP-negative cells from 0.5- and 1.5-yr-old K15-EGFP mice as determined by Flow-FISH. Bars indicate standard errors. (n) Cells analyzed per condition. Statistical significance using Kolmogorov-Smirnov tests is indicated. (G) Telomere length as determined by TRF in sorted GFP and GFP+ tail skin keratinocytes from K15-EGFP mice. Note increased TRF size in GFP+ hair bulge cells compared with GFP cells. (H) Telomerase TRAP activity of purified GFP+ and GFP keratinocytes from K15-EGFP mice. The protein concentration is indicated. Samples were pretreated (+) or not (−) with RNase. (IC) Internal control. HeLa cells are shown as positive control.
Figure 3.
Figure 3.
Telomapping maps the longest telomeres to the EGFP+ cells in K15-EGFP skin sections. (A) Simultaneous detection of GFP and telomere fluorescence in K15-EGFP back skin. The different epidermal compartments are indicated and separated from the dermis by a dashed line. Right panels show confocal images corresponding to Alexa488 fluorescence and the combined DAPI + GFP image. Note that GFP-expressing cells localize to the bulge area of the hair follicle. Left panels show topographic telomere length maps generated according to GFP status: all nuclei, GFP nuclei, and GFP+ nuclei. Nuclei are colored according to their average telomere fluorescence in arbitrary units. GFP-positive cells at the hair bulge showed the longest telomeres. Bars, 50 μm. (B) Telomere fluorescence frequency histograms according to GFP status in back and tail skin hair follicles from K15-EGFP mice. Differences in telomere length between GPF+ and GFP cells were highly significant (P < 0.001), both in the back and tail skin. Average telomere fluorescence and SD are indicated. (n) Number of nuclei analyzed. Four to six skin sections of either tail or back skin from a total of two mice were analyzed. The red lines highlight the increased frequency of long telomeres in GFP-positive cells. (C) Percentage of cells with the longest telomeres (red color) or with the shortest telomeres (green color) that are either GFP+ or GFP. Note that GFP+ cells are enriched in the population of the cells with the longest telomeres.
Figure 4.
Figure 4.
Cells with the longest telomeres locate to stem cell compartments in different origin mouse tissues. (A) Representative telomapping image of a small intestine section generated from confocal telomere Q-FISH images. The different small intestine compartments are indicated. The dashed line separates the epithelial cells (ep) from other cell types not studied here: lamina propia (LP), muscularis mucosa (mm), and submucosa (subm). Bar, 70 μm. Nuclei are colored according to their average telomere fluorescence in arbitrary units. (B) Scheme depicting the small intestine villi and Lieberkühn crypts. The crypts are further divided in (1) the Paneth cells at the bottom of the crypt between positions +1 and +3, (2) positions +4 to +5, and (3) the TA compartment at positions greater than +5. (C) Percentage of cells showing a given telomere fluorescence within the different compartments. The +4 to +5 positions and the TA compartment are enriched in cells with the longest telomeres (red color), while the villi are enriched in cells with the shortest telomeres (green color). Average and SD are indicated. A total of 39 crypts and 28 villi from three independent mice were quantified. (n) Number of nuclei per compartment analyzed. Number in parentheses indicates the cell position in the crypt. (D) Telomere length frequency histograms for cells located in the indicated compartments. Average and SD are indicated. A total of 39 crypts and 28 villi from three independent mice were quantified. (n) Number of nuclei per compartment analyzed for telomere FISH. Vertical colored lines indicate the different telomere fluorescence ranges. All telomere fluorescence comparisons between the +4 to +5 positions and the rest of the compartments are highly significant (P < 0.001), except significant (P < 0.05) for comparison with the TA compartment. (EG) Left panels show representative telomapping images from cornea (E), testis (F), and brain hippocampus (G) of wild-type mice. Nuclei are colored according to their average telomere fluorescence in arbitrary units. Bars, 200 μm. Magnifications of cornea and brain are also shown. Note that cells with the longest telomeres localize preferentially within the described stem cell compartment of each organ. Middle panels show the percentage of cells containing a given telomere fluorescence within each epidermal compartment. Right panels show telomere fluorescence histograms of nuclei in each compartment. Average telomere fluorescence and SD are indicated. The red lines highlight the increased frequency of cells with long telomeres in the analyzed stem cell compartments. A total of six different images from each organ from three independent mice were used for quantification purposes. (CB) Ciliary body, (L) lens, (SGZ) subgranular zone, (GCL) granular cell layer, (H) hilus, (CA) pyramidal cell layers. All telomere fluorescence comparisons between each of the stem cell compartments and the corresponding differentiated compartment are highly significant (P < 0.001).
Figure 5.
Figure 5.
Telomere shortening with age in mouse stem cell compartments. Representative telomapping images of different age wild-type (A,B, right panels), G1 (B, left panels), and G3 Terc−/− (C) tail skin. Nuclei are colored according to their average telomere fluorescence in arbitrary units. The different epidermal compartments are indicated and are separated from the dermis by a dashed line. Asterisk indicates the sebaceous glands. Bars, 50 μm. Note that cells with the longest telomeres at the hair bulge area decrease in both wild-type mice and G1 Terc−/− mice with increasing age, but with a higher rate in the case of G1 Terc−/− mice. (B) Right panels show the percentage of cells showing a given telomere fluorescence within the indicated epidermal compartment. A total of two skin sections per mouse out of three mice per genotype were used for quantification of percentage of cells and standard deviation. (n) Total number of cells within the indicated compartment used for the analysis. (D) Telomere length frequency histograms for cells located in the indicated compartments in mice of the indicated age and genotype. A G3 Terc−/− mouse is shown for comparison. (n) Number of nuclei per compartment analyzed for telomere FISH. Statistical significance values are indicated. (E) Average telomere fluorescence in the indicated stem cell compartments at the indicated age. Note a faster rate of telomere loss at >1 yr of age. (F) Average telomere fluorescence in the indicated differentiated compartments of different tissues at the indicated ages.
Figure 6.
Figure 6.
Decreased clonogenic potential of epidermal stem cells with mouse aging. Aging affects the proliferative potential of mouse keratinocyte stem cells. Quantification of size and number of macroscopic colonies obtained from isolated keratinocytes from 2-d-old, 2-mo-old, and 27- to 31-mo-old mice and cultured for 10 d on J2-3T3 mitomycin C-treated feeder fibroblast. Note that colony number decreases with aging. Statistical significance values are indicated.

References

    1. Alvarez-Buylla A., Lim D.A. For the long run: Maintaining germinal niches in the adult brain. Neuron. 2004;41:683–686. - PubMed
    1. Barker N., van Es J.H., Kuipers J., Kujala P., van den Born M., Cozijnsen M., Haegebarth A., Korving J., Begthel H., et al. Identification of stem cells in small intestine and colon by marker gene Lgr5. Nature. 2007;449:1003–1007. - PubMed
    1. Barrandon Y., Green H. Three clonal types of keratinocyte with different capacities for multiplication. Proc. Natl. Acad. Sci. 1987;84:2302–2306. - PMC - PubMed
    1. Blasco M.A. Telomeres and human disease: Cancer, ageing and beyond. Nat. Rev. Genet. 2005;6:611–622. - PubMed
    1. Blasco M.A., Lee H.-W., Hande P., Samper E., Lansdorp P., DePinho R., Greider C.W. Telomere shortening and tumor formation by mouse cells lacking telomerase RNA. Cell. 1997;91:25–34. - PubMed

Publication types

LinkOut - more resources