. 2008 Feb;10(2):149-59.
doi: 10.1593/neo.07909.

The role of fascin in the migration and invasiveness of malignant glioma cells

Affiliations

The role of fascin in the migration and invasiveness of malignant glioma cells

Jeong Hyun Hwang et al. Neoplasia. 2008 Feb.

Abstract

Malignant glioma is the most common primary brain tumor, and its ability to invade the surrounding brain parenchyma is a leading cause of tumor recurrence and treatment failure. Whereas the molecular mechanisms of glioma invasion are incompletely understood, there is growing evidence that cytoskeletal-matrix interactions contribute to this process. Fascin, an actin-bundling protein, induces parallel actin bundles in cell protrusions and increases cell motility in multiple human malignancies. The role of fascin in glioma invasion remains unclear. We demonstrate that fascin is expressed in a panel of human malignant glioma cell lines, and downregulation of fascin expression in glioma cell lines by small interfering RNA (siRNA) is associated with decreased cellular attachment to extracellular matrix (ECM) and reduced migration. Using immunofluorescence analysis, we show that fascin depletion results in a reduced number of filopodia as well as altered glioma cell shape. In vitro invasiveness of U251, U87, and SNB19 glioma cells was inhibited by fascin siRNA treatment by 52.2%, 40.3%, and 23.8% respectively. Finally, we show a decreased invasiveness of U251-GFP cells by fascin knockdown in an ex vivo rat brain slice model system. This is the first study to demonstrate a role for fascin in glioma cell morphology, motility, and invasiveness.


Figures
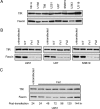
Figure 1
Figure 1
Expression of fascin protein in glioma cell lines and fascin knockdown by siRNA. (A) Western blot analysis of fascin expression in astrocytoma cell lines and normal human astrocytes. (B) Fascin expression following transfection with siRNA for fascin1 in U251, U87, and SNB19 cell lines. (C) Fascin knockdown by siRNA in U251 cells reaches an optimum elimination at 72 hours after transfection. Expression of human transferrin receptor served as a loading control. NHA, normal human astrocytes; NT, nontargeting siRNA; TfR, human transferrin receptor, Fs1 and Fs2, two different fascin1 knockdown sequences used.
Figure 2
Figure 2
Morphology of glioma cells following fascin siRNA transfection. After siRNA transfection, cells were plated on laminin-precoated coverslips for immunofluorescence. Cells were labeled with Texas Red-X phalloidin for F-actin. Fascin was labeled with anti-fascin antibody followed by Alexa Fluor 488-conjugated anti-mouse antibody. Arrows show staining for fascin at the leading edge in lamellipodia, and arrowheads demonstrate filopodia bundles. Scale bar, 100 µm.
Figure 3
Figure 3
Inhibition of filopodia formation by fascin knockdown. Cells were seeded on laminin-coated coverslips after fascin siRNA transfection. Actin filaments were labeled with Texas Red-X phalloidin. Arrows show filopodial bundles from cell edge in untransfected cells. In contrast to control cells, fascin depleted U87 and SNB19 glioma cells demonstrate reduced number of filopodia. Arrowheads indicate the residual filopodia of SNB19 cell after fascin knockdown. Bar, 25 µm.
Figure 4
Figure 4
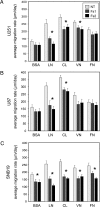
The effects of fascin knockdown on glioma cell adhesion to ECM. (A) U251, (B) U87, and (C) SNB19 cells were plated and allowed to adhere for 3 hours on different ECM substrates at 72 hours after transfection with fascin siRNA. After washing, crystal violet bound to the attached cells were solubilized and the absorbance was measured at 595 nm. Asterisks indicate statistically significant change (P < .05) in adhesion after fascin silencing. Columns represent the average optical absorbance of three independent experiments. Bars show SE. LN, laminin; CL, collagen type IV; VN, vitronectin; FN, fibronectin.
Figure 5
Figure 5
The effects of fascin knockdown on glioma cell migration using microliter-scale radial migration assay. (A) U251, (B) U87, and (C) SNB19 cells were transfected with siRNA and seeded through a cell sedimentation manifold to establish a circular confluent monolayer on substrate-coated well. The cells were allowed to migrate for 24 hours, and photographs were taken before and after migration. Average migration rate was calculated as the change in the diameter of the circle circumscribing the cell population over a 24-hour period. Asterisks indicate statistically significant changes (P < .05) in migration rate after fascin silencing. Columns represent the average migration rate of three independent experiments. Bars show SE.
Figure 6
Figure 6
Matrigel invasion assay after fascin elimination. (A) Modified Boyden chamber with Matrigel-precoated membrane filter insert was used to measure in vitro invasiveness. After 24 hours of incubation, the cells that migrated through the membrane were stained, and representative fields were photographed. Original magnification, 200x. (B) Invasion was quantified by counting cells in six random fields. The invasion rate of the three cell lines is significantly reduced by fascin depletion. Asterisks indicate statistically significant changes (P < .01) after fascin silencing. Columns represent the average of the number of cells per field of at least six fields in three independent experiments. Bars show SE.
Figure 7
Figure 7
Ex vivo invasion assay. (A) Western blot analysis demonstrates fascin knockdown in U251-GFP cells following siRNA transfection (B) Rat brain slice model system was used to measure ex vivo invasiveness. Cells transfected by fascin siRNA were transplanted into the center of putamen on brain slice and allowed to invade for 72 hours. Serial images were taken every 10 µm downward from the top surface to the bottom of the slice with an inverted confocal microscopy, and the area of GFP-stained cells in each section was calculated. Photographs depict the representative fields. Scale bar, 500 µm., (C) The depth of invasion at 72 hours was used to determine the invasiveness of the glioma cells. The depth of invasion of fascin depleted cells decreased by 21.4% (P < .01) compared to control cells. The mean value was obtained from three experiments. Bars show SE.

Similar articles

Cited by

References

    1. Burger PC, Vogel FS, Green SB, Strike TA. Glioblastoma multiforme and anaplastic astrocytoma. Pathologic criteria and prognostic implications. Cancer. 1985;56(5):1106–1111. - PubMed
    1. Stupp R, Hegi ME, Gilbert MR, Chakravarti A. Chemoradiotherapy in malignant glioma: standard of care and future directions. J Clin Oncol. 2007;25(26):4127–4136. - PubMed
    1. Soffietti R, Leoncini B, Ruda R. New developments in the treatment of malignant gliomas. Expert Rev Neurother. 2007;7(10):1313–1326. - PubMed
    1. Goffman TE, Dachowski LJ, Bobo H, Oldfield EH, Steinberg SM, Cook J, Mitchell JB, Katz D, Smith R, Glatstein E. Long-term followup on National Cancer Institute Phase I/II study of glioblastoma multiforme treated with iododeoxyuridine and hyperfractionated irradiation. J Clin Oncol. 1992;10(2):264–268. - PubMed
    1. Senger D, Cairncross JG, Forsyth PA. Long-term survivors of glioblastoma: statistical aberration or important unrecognized molecular subtype? Cancer J. 2003;9(3):214–221. - PubMed

Publication types

LinkOut - more resources