. 2008 Apr;28(8):2718-31.
doi: 10.1128/MCB.02017-07. Epub 2008 Feb 19.

Ezh2 requires PHF1 to efficiently catalyze H3 lysine 27 trimethylation in vivo

Affiliations

Ezh2 requires PHF1 to efficiently catalyze H3 lysine 27 trimethylation in vivo

Kavitha Sarma et al. Mol Cell Biol. 2008 Apr.

Abstract

The mammalian Polycomblike protein PHF1 was previously shown to interact with the Polycomb group (PcG) protein Ezh2, a histone methyltransferase whose activity is pivotal in sustaining gene repression during development and in adulthood. As Ezh2 is active only when part of the Polycomb Repressive Complexes (PRC2-PRC4), we examined the functional role of its interaction with PHF1. Chromatin immunoprecipitation experiments revealed that PHF1 resides along with Ezh2 at Ezh2-regulated genes such as the HoxA loci and the non-Hox MYT1 and WNT1 genes. Knockdown of PHF1 or of Ezh2 led to up-regulated HoxA gene expression. Interestingly, depletion of PHF1 did correlate with reduced occupancy of Bmi-1, a PRC1 component. As expected, knockdown of Ezh2 led to reduced levels of its catalytic products H3K27me2/H3K27me3. However, reduced levels of PHF1 also led to decreased global levels of H3K27me3. Notably, the levels of H3K27me3 decreased while those of H3K27me2 increased at the up-regulated HoxA loci tested. Consistent with this, the addition of PHF1 specifically stimulated the ability of Ezh2 to catalyze H3K27me3 but not H3K27me1/H3K27me2 in vitro. We conclude that PHF1 modulates the activity of Ezh2 in favor of the repressive H3K27me3 mark. Thus, we propose that PHF1 is a determinant in PcG-mediated gene repression.


Figures
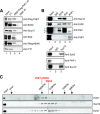
FIG. 1.
FIG. 1.
PHF1 interacts with the PRC2 complex. (A) Western analysis of the proteins after immunoprecipitation using anti-FLAG antibody from a stable cell line containing FLAG-tagged PHF1. (B) Top panel: endogenous IP of HeLa nuclear extracts by use of antibodies against Ezh2 (lane 3), Eed (lane 4), and PHF1 (lane 5). Antibodies used for Western blotting are indicated to the right. Bottom panel: endogenous IP of HeLa nuclear extracts by use of antibodies against Suz12 (lane 3) and PHF1 (lane 4). An immunoglobulin G (IgG) control is included in each experiment (lane 2). (C) Superose 6 gel filtration analysis of the FLAG-immunoprecipitated PHF1. Migration of molecular markers is indicated above the panels, and the antibodies for Western blotting are indicated to the right of the panels.
FIG. 2.
FIG. 2.
PHF1 localizes to Ezh2 target promoters. (A) ChIP of HeLa cells by use of antibodies specific to Ezh2 or PHF1. Enrichment is shown as percent bound/input and was analyzed by qPCR for the promoters or coding regions indicated on the x axis. (B) ChIP across the MYT1 distal promoter locus, showing the binding profiles of Ezh2 and PHF1 (left panel) and of H3K27me2 and H3K27me3 (right panel). The results for H3K27me2 and H3K27me3 have been corrected for nucleosome occupancy by comparison with binding of H3 across the region. The x axis indicates the region that was amplified, as shown in the schematic representation of the MYT1 promoter.
FIG. 3.
FIG. 3.
PHF1 is a transcriptional repressor. (A) Schematic of the luciferase gene under the control of the TK promoter, with Gal4 DNA binding sites upstream. Transfections were performed with Gal4 alone and with Gal4-PHF1-HA and FLAG-PHF1-HA constructs. Luciferase activity was measured after 48 h and normalized to the levels of β-galactosidase expression. Western blot analysis shows the overexpression of the proteins indicated for each experiment. Actin was used as a loading control. (B and C) ChIP was performed in cells before (−Tet) and after (+Tet) a 12-h treatment with tetracycline to induce Gal4-PHF1-HA expression, as indicated below the graphs and as seen by Western blotting results. Panel B shows the results of analysis of PHF1, Ezh2, Suz12, Bmi1, and RNA polymerase II at the TK promoter and panel C the histone modifications at the same locus (as indicated above the graph) upon induction of Gal4-PHF1. (D and E) ChIP was performed with cells upon induction of Gal4-Ezh2 or Gal4-Ezh2 H689A with tetracycline (as indicated below the graphs). Panel D shows the analysis of Ezh2, Suz12, PHF1, Bmi1, H3K27me2, and H3K27me3 at the TK promoter upon expression of wild-type Gal4-Ezh2. Panel E shows analysis of Ezh2, H3K27me2, and H3K27me3 at the TK promoter upon expression of the Gal4-Ezh2 H689A mutant. All results in Panels B to E represent averages of the results of at least three independent experiments quantified by qPCR. Standard error bars are shown. (F) Gal4-PHF1 was induced by addition of tetracycline, and cells were harvested at the indicated time points after removal of tetracycline (as indicated below the graph). Luciferase expression was measured at each time point (top). Standard error bars are indicated. Gal4-PHF1 protein levels were also measured at each time point (bottom). The red arrow shows the time at which tetracycline was removed. The asterisk indicates the specific Gal4-PHF1-HA band with anti HA antibodies. Actin served as a loading control. (G) Chromatin immunoprecipitation was carried out before and after induction of Gal4-PHF1 and at days 2, 4, and 6 after release from tetracycline. The antibodies used are indicated to the right of the panels. The red arrow shows the time of removal of tetracycline.
FIG. 4.
FIG. 4.
PHF1 and Ezh2 are recruited independently of each other. (A) ChIP of HeLa cells upon knockdown of Ezh2. Although levels of Ezh2 were reduced at both the MYT1 (left panel) and HoxA9 (right panel) promoters, the levels of PHF1 at these loci were not affected. (B) qRT-PCR analysis of PHF1 and MTF2 upon stable PHF1 knockdown. mRNA levels are shown relative to those of GAPDH (left panel). PHF1 RNA levels were reduced to 30 to 40% of original levels, while MTF2 RNA levels were not changed. The results of ChIP of HeLa cells upon knockdown of PHF1 are shown. Levels of PHF1 as well as the PRC1 component Bmi-1 were reduced at both the MYT1 (middle panel) and HoxA9 (right panel) promoters, while the levels of Ezh2 were not affected.
FIG. 5.
FIG. 5.
(A) Analysis of histone modifications at the HoxA9 promoter upon knockdown of Ezh2. Ezh2 knockdown led to decreased levels of H3K27me3 and H3K27me2. The ratios of H3K27me2 and of H3K27me3 levels to total histone H3 levels are shown. (B) Changes in histone modifications at the HoxA4, A6, A9, and A11 promoters upon PHF1 knockdown. The presence of PHF1-KD led to reduced levels of H3K27me3 (right panel) and slightly increased levels of H3K27me2 (left panel). Results are shown as ratios with respect to total histone H3 levels. (C) Left panel: Western blot showing knockdown of PHF1 and Ezh2 proteins upon siRNA treatment, as indicated at the bottom of the panel. Right panel: qRT-PCR for HoxA4, A6, and A11 genes upon PHF1-KD, Ezh2 KD, or double knockdown (as indicated below the graph). Hox A4 was not affected by either knockdown procedure, but both HoxA6 and A11 were up-regulated to the same extent upon knockdown of PHF1 or Ezh2. They were not further up-regulated upon combined knockdown of PHF1 and Ezh2.
FIG. 6.
FIG. 6.
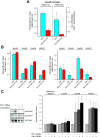
PHF1-KD results in reduced global H3K27me3 levels and affects cell proliferation. (A) Western blot analysis of acid-extracted histones from untreated HeLa and PHF1-KD cell lines showed a reduction in H3K27me3 but not in H3K27me1 or H3K27me2 levels in the case of PHF1-KD. (B) Western analysis of HeLa and PHF1-KD cell lines showed no reduction in levels of Ezh2 or Suz12 (top and middle panels, respectively). Actin was used as a loading control (bottom panel). (C) An siRNA pool was purchased from Dharmacon (siGENOME SMARTpool catalog no. M-011353-00). U2OS or 293F cells were transfected by use of RNAiFect (Qiagen) per the manufacturer's protocol. Efficient knockdown of PHF1 was confirmed by RT-PCR (left panel). Acid-extracted proteins were analyzed by sodium dodecyl sulfate-polyacrylamide gel electrophoresis followed by Western blotting using the antibodies indicated on the right. PHF1 knockdown resulted in a drastic decrease in H3K27me3 levels but not H3K27me2 or H3K27me1 levels (middle panel). Ezh2 levels are also not affected in PHF1 RNA interference samples (right panel). (D) Cell proliferation assays in HeLa and PHF1-KD cell lines indicate a dramatic decrease in cell proliferation with reduced PHF1 expression. (E) Microscopic analysis of untreated and PHF1-KD HeLa cells with a reduced number of cells in the PHF1-KD samples at day 5. (F) BrdU analysis of Ezh2- and PHF1-depleted cells. The panels above the table show a merged image of cells stained with DAPI (4′,6′-diamidino-2-phenylindole) (blue) and BrdU (red). The table indicates the total number of cells counted for each experimental sample as well as the percentages of those that were BrdU positive.
FIG. 7.
FIG. 7.
PHF1 stimulates PRC2 activity in vitro. (A) Coomassie blue staining of purified FLAG-PHF1 and PRC2 complex containing FLAG-Eed3. Asterisks indicate FLAG-PHF1 cleavage products. (B) Site specificity of PRC2 and PRC2-PHF1. Wild-type (WT) and mutant (H3K9A, H3K27A, and H3K9AK27A) octamers were incubated with PRC2 in the absence or presence of PHF1 to determine site specificity. Histone methyltransferase activity was absent in the case of octamers with the H3K27A mutation as well as the double mutant (lanes 3, 4, 7, and 8). (C) Left panel: HMT activity of PRC2 and FLAG-PHF1 purified from Hi-5 cells. Middle panel, HMT activity of PRC2 as a function of PHF1 addition. Lane 1, PRC2 complex alone; lanes 2 to 4, PRC2 with increasing amounts of PHF1. Right panel: HMT activity of PRC2 as a function of BSA addition. Lane 1, PRC2 complex alone; lanes 2 to 4, PRC2 with increasing amounts of BSA. Coomassie staining of histones is shown below the autoradiograph. (D) Western blot analysis of the HMT reaction mixtures containing PRC2 and PRC2-PHF1 by use in the antibodies indicated on the right. The samples in each lane are as indicated above the panels. Mono- and dimethyl K27 levels did not change between the PRC2 and PRC2-PHF1 experiments, while trimethyl K27 levels were slightly increased in the PRC2-PHF1 reaction (compare lanes 5 and 6). Ponceau staining of histones is shown in the last panel to confirm equal loading levels. Results of three independent experiments (Expt) are shown. (E) Top panel: in the absence of PHF1, PRC2 complexes at the promoters would not be stably tethered, leading them to move along the gene. This transient residence of Ezh2 at its targets would cause catalysis to an H3K27me2 state but not to the complete H3K27me3 state. Alternatively, H3K27me2 could be catalyzed by the PRC2 complex prior to histone deposition. The H3K27me2 mark might have been an intermediate in repression, whereupon further action of PRC2 in the presence of PHF1 led to trimethylation and consequently repression. H3K27me2 might have other functions unrelated to regulation of gene expression that are as yet unknown. Bottom panel: upon recruitment of PHF1 to the target gene promoters, PRC2 complexes would be stabilized and further stimulated to catalyze H3K27me3 formation to establish as well as maintain repression at these sites. We propose that the differential distribution of the H3K27me2 and H3K27me3 marks is in part a consequence of PHF1 recruitment to specific genomic loci.

Similar articles

Cited by

References

    1. Blais, A., M. Tsikitis, D. Acosta-Alvear, R. Sharan, Y. Kluger, and B. D. Dynlacht. 2005. An initial blueprint for myogenic differentiation. Genes Dev. 19553-569. - PMC - PubMed
    1. Botuyan, M. V., J. Lee, I. M. Ward, J. E. Kim, J. R. Thompson, J. Chen, and G. Mer. 2006. Structural basis for the methylation state-specific recognition of histone H4-K20 by 53BP1 and Crb2 in DNA repair. Cell 1271361-1373. - PMC - PubMed
    1. Boyer, L. A., K. Plath, J. Zeitlinger, T. Brambrink, L. A. Medeiros, T. I. Lee, S. S. Levine, M. Wernig, A. Tajonar, M. K. Ray, G. W. Bell, A. P. Otte, M. Vidal, D. K. Gifford, R. A. Young, and R. Jaenisch. 2006. Polycomb complexes repress developmental regulators in murine embryonic stem cells. Nature 441349-353. - PubMed
    1. Bracken, A. P., N. Dietrich, D. Pasini, K. H. Hansen, and K. Helin. 2006. Genome-wide mapping of Polycomb target genes unravels their roles in cell fate transitions. Genes Dev. 201123-1136. - PMC - PubMed
    1. Bracken, A. P., D. Pasini, M. Capra, E. Prosperini, E. Colli, and K. Helin. 2003. EZH2 is downstream of the pRB-E2F pathway, essential for proliferation and amplified in cancer. EMBO J. 225323-5335. - PMC - PubMed

Publication types

MeSH terms

LinkOut - more resources