

Pseudomonas aeruginosa cystic fibrosis isolates from individual patients demonstrate a range of levels of lethality in two Drosophila melanogaster infection models
- PMID: 18285499
- PMCID: PMC2346680
- DOI: 10.1128/IAI.01165-07
Pseudomonas aeruginosa cystic fibrosis isolates from individual patients demonstrate a range of levels of lethality in two Drosophila melanogaster infection models
Abstract
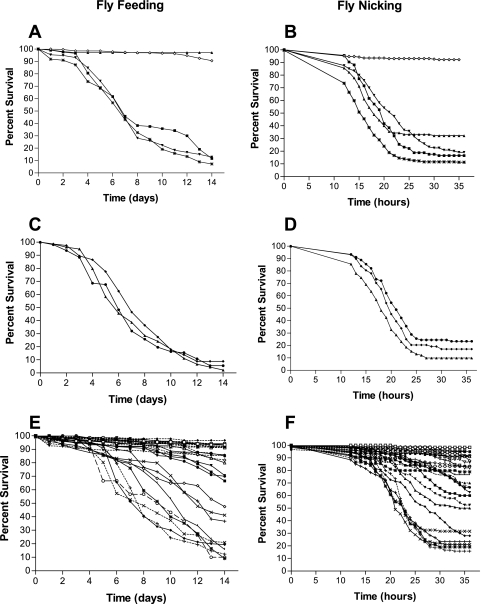
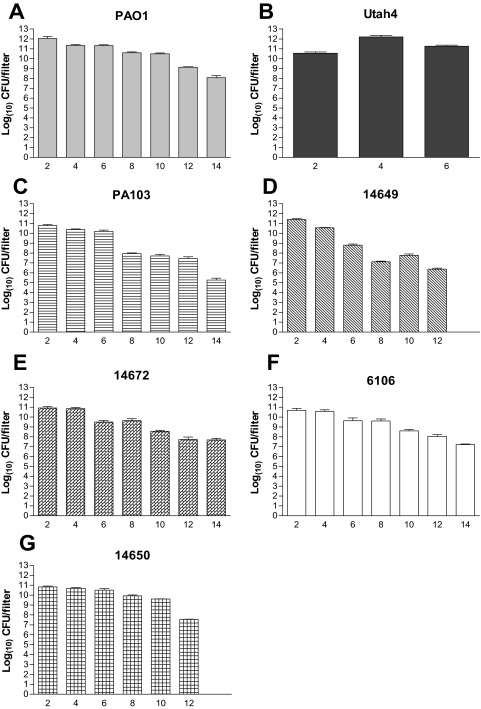
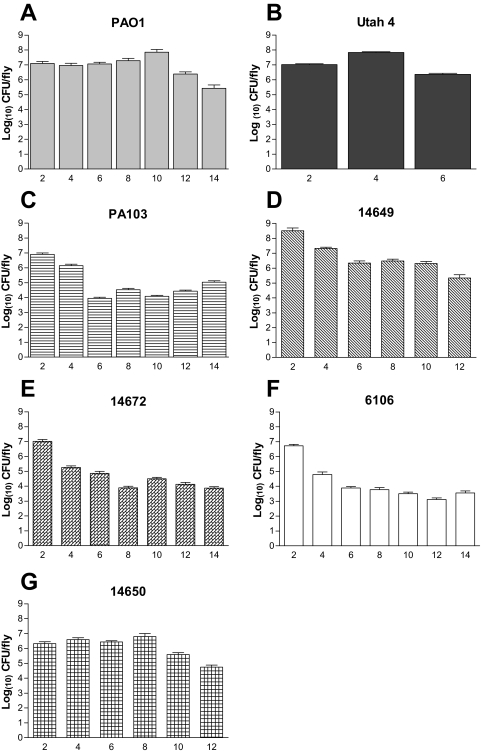
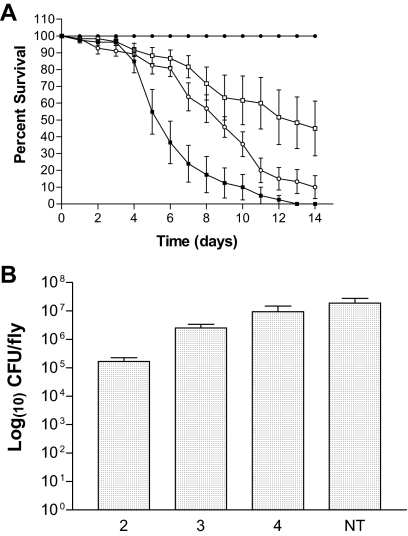
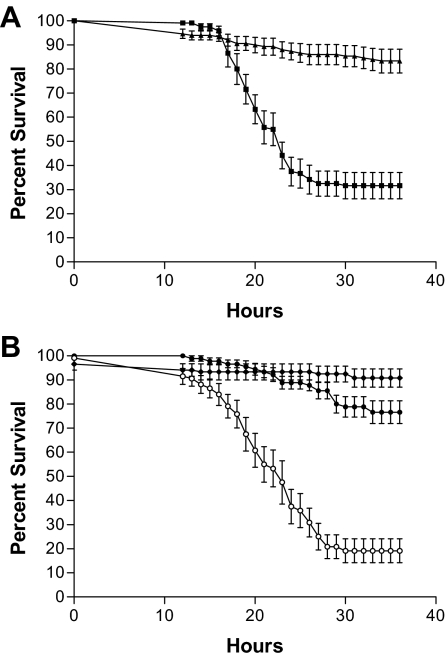
Recently, two Drosophila melanogaster models of infection, fly feeding and fly nicking, have been developed that allow a determination of pathogenic potential of Pseudomonas aeruginosa isolates. In this study, control strains, isolates from burn wounds, and isolates from the sputa of cystic fibrosis (CF) patients were used to compare the two infection models to determine whether any of the isolates might be better adapted to either of the models. In addition, our goal was to determine the variability of isolates from individual CF patients. Three of four control strains (PAO1, PAK, and PA14) caused significant mortality in the flies in both models of infection. The remaining control strain, PA103, was lethal to flies in the nicking model but lacked significant lethality in the feeding model. The burn wound isolates had a high level of lethality in both models. Interestingly, the CF isolates had the largest diversity of lethality in both models of infection. The range of pathogenic potentials of the CF isolates occurred across a cohort of patients, both at the patient level and down to the level of individual sputum samples. The majority of all isolates had similar levels of lethality in both fly infection models. However, two CF isolates were significantly more lethal in the nicking model, and three CF isolates were significantly more lethal in the feeding model. In conclusion, the two Drosophila infection models were useful for the analysis of the diversity of pathogenic potentials of P. aeruginosa isolates.
Figures
Similar articles
-
Cystic fibrosis-niche adaptation of Pseudomonas aeruginosa reduces virulence in multiple infection hosts.PLoS One. 2012;7(4):e35648. doi: 10.1371/journal.pone.0035648. Epub 2012 Apr 25. PLoS One. 2012. PMID: 22558188 Free PMC article.
-
Genotypic and Phenotypic Diversity of Staphylococcus aureus Isolates from Cystic Fibrosis Patient Lung Infections and Their Interactions with Pseudomonas aeruginosa.mBio. 2020 Jun 23;11(3):e00735-20. doi: 10.1128/mBio.00735-20. mBio. 2020. PMID: 32576671 Free PMC article.
-
Lethality and cooperation of Pseudomonas aeruginosa quorum-sensing mutants in Drosophila melanogaster infection models.Microbiology (Reading). 2012 Aug;158(Pt 8):2125-2132. doi: 10.1099/mic.0.054999-0. Epub 2012 May 24. Microbiology (Reading). 2012. PMID: 22628480
-
Microevolution of Pseudomonas aeruginosa to a chronic pathogen of the cystic fibrosis lung.Curr Top Microbiol Immunol. 2013;358:91-118. doi: 10.1007/82_2011_199. Curr Top Microbiol Immunol. 2013. PMID: 22311171 Review.
-
Pseudomonas aeruginosa chromosomal beta-lactamase in patients with cystic fibrosis and chronic lung infection. Mechanism of antibiotic resistance and target of the humoral immune response.APMIS Suppl. 2003;(116):1-47. APMIS Suppl. 2003. PMID: 14692154 Review.
Cited by
-
Massively parallel mutant selection identifies genetic determinants of Pseudomonas aeruginosa colonization of Drosophila melanogaster.mSystems. 2024 Mar 19;9(3):e0131723. doi: 10.1128/msystems.01317-23. Epub 2024 Feb 21. mSystems. 2024. PMID: 38380971 Free PMC article.
-
Lethality and developmental delay in Drosophila melanogaster larvae after ingestion of selected Pseudomonas fluorescens strains.PLoS One. 2010 Sep 13;5(9):e12504. doi: 10.1371/journal.pone.0012504. PLoS One. 2010. PMID: 20856932 Free PMC article.
-
Hospital infections, animal models and alternatives.Eur J Clin Microbiol Infect Dis. 2009 Jun;28(6):561-8. doi: 10.1007/s10096-008-0680-6. Epub 2008 Dec 19. Eur J Clin Microbiol Infect Dis. 2009. PMID: 19096886 Review.
-
The genetic basis for variation in resistance to infection in the Drosophila melanogaster genetic reference panel.PLoS Pathog. 2017 Mar 3;13(3):e1006260. doi: 10.1371/journal.ppat.1006260. eCollection 2017 Mar. PLoS Pathog. 2017. PMID: 28257468 Free PMC article.
-
Differential expression of the major catalase, KatA in the two wild type Pseudomonas aeruginosa strains, PAO1 and PA14.J Microbiol. 2019 Aug;57(8):704-710. doi: 10.1007/s12275-019-9225-1. Epub 2019 Jun 11. J Microbiol. 2019. PMID: 31187416
References
-
- Anonymous. 2002. Patient registry 2001 annual report. Cystic Fibrosis Foundation, Bethesda, MD.
-
- Boman, H. G., I. Nilsson, and B. Rasmuson. 1972. Inducible antibacterial defense system in Drosophila. Nature 237232-235. - PubMed
-
- Burns, J. L., R. L. Gibson, S. McNamara, D. Yim, J. Emerson, M. Rosenfeld, P. Hiatt, K. McCoy, R. Castile, A. L. Smith, and B. W. Ramsey. 2001. Longitudinal assessment of Pseudomonas aeruginosa in young children with cystic fibrosis. J. Infect. Dis. 183444-452. - PubMed
-
- Cash, H. A., D. E. Woods, B. McCullough, W. G. Johanson, Jr., and J. A. Bass. 1979. A rat model of chronic respiratory infection with Pseudomonas aeruginosa. Am. Rev. Respir. Dis. 119453-459. - PubMed
Publication types
MeSH terms
LinkOut - more resources
Full Text Sources
Other Literature Sources
Medical
Molecular Biology Databases
