. 2008 Feb 20;3(2):e1652.
doi: 10.1371/journal.pone.0001652.

Precancerous stem cells can serve as tumor vasculogenic progenitors

Affiliations

Precancerous stem cells can serve as tumor vasculogenic progenitors

Rulong Shen et al. PLoS One. .

Abstract

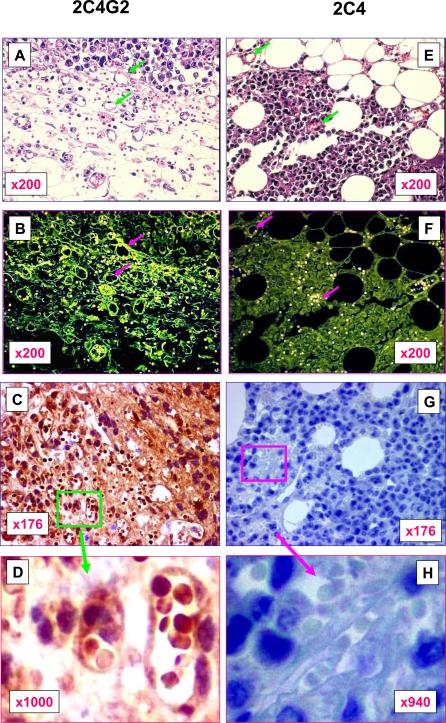
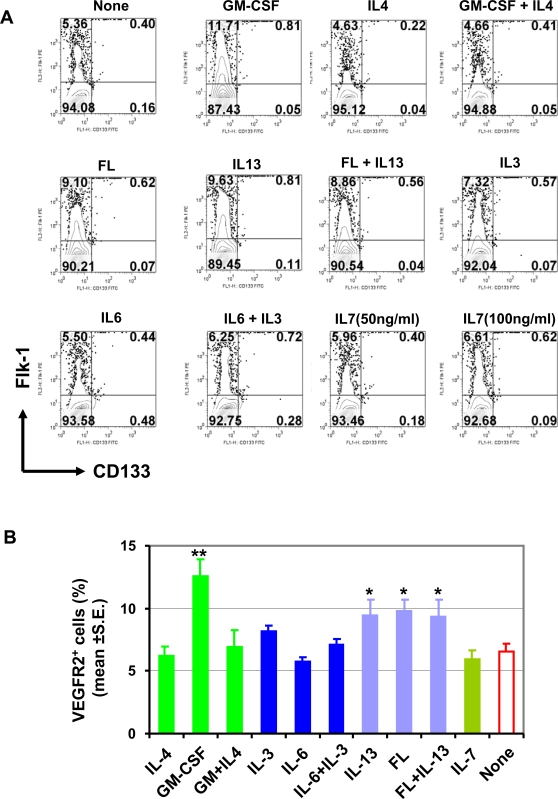
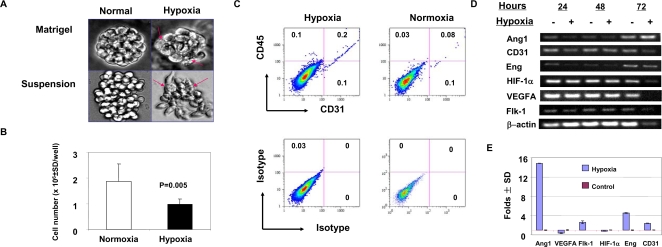
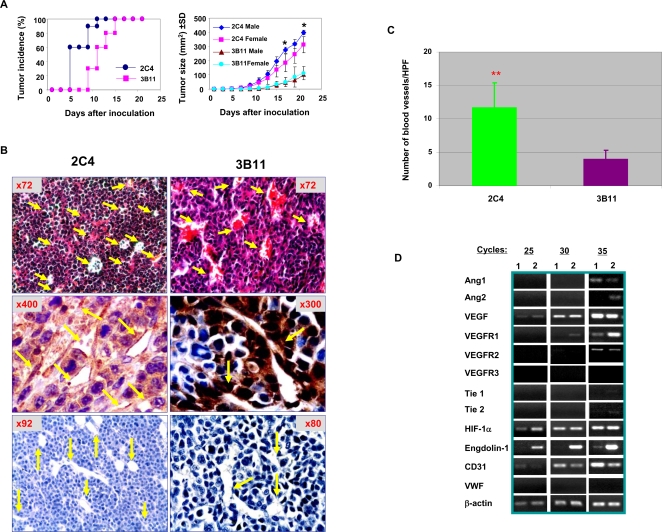
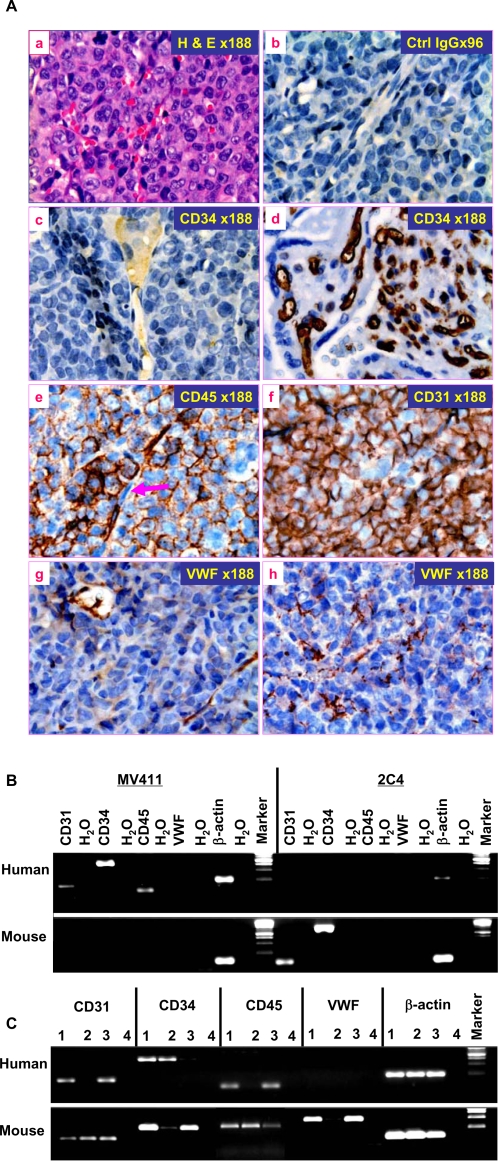
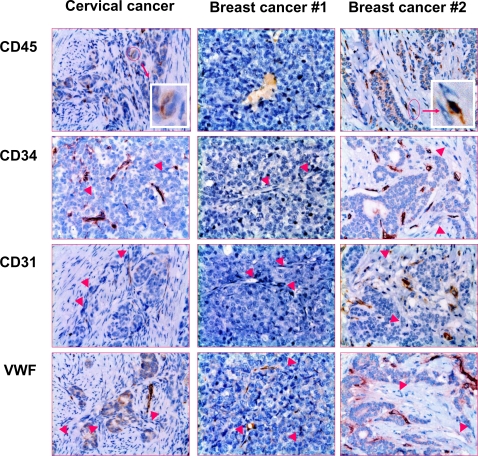
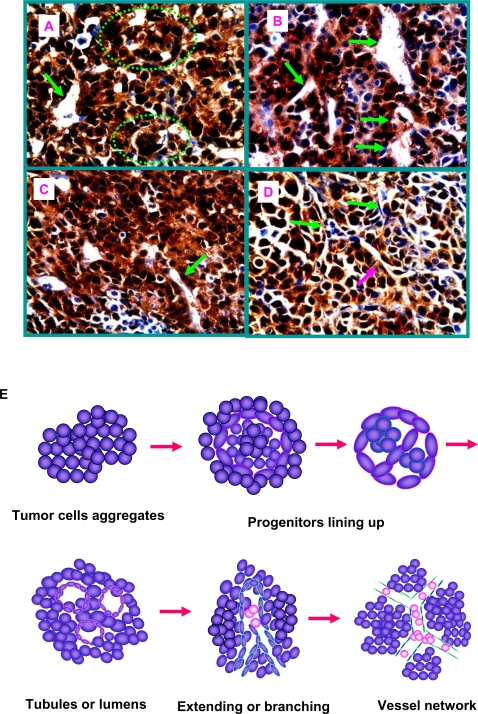
Tumor neo-vascularization is critical for tumor growth, invasion and metastasis, which has been considered to be mediated by a mechanism of angiogenesis. However, histopathological studies have suggested that tumor cells might be the progenitor for tumor vasculature. Recently, we have reported that the precancerous stem cells (pCSCs) representing the early stage of developing cancer stem cells (CSCs), have the potential for both benign and malignant differentiation. Therefore, we investigated whether pCSCs serve as progenitors for tumor vasculogenesis. Herein, we report that in the pCSC-derived tumors, most blood vessels were derived from pCSCs. Some pCSCs constitutively expressed vasculogenic receptor VEGFR-2, which can be up-regulated by hypoxia and angiogenesis-promoting cytokines, such as GM-CSF, Flt3 ligand, and IL-13. The pCSCs are much more potent in tumor vasculogenesis than the differentiated tumor monocytic cells (TMCs) from the same tumor, which had comparable or even higher capacity to produce some vascular growth factors, suggesting that the potent tumor vasculogenesis of pCSCs is associated with their intrinsic stem-like property. Consistently tumor vasculogenesis was also observed in human cancers such as cervical cancer and breast cancer and xenograft lymphoma. Our studies indicate that pCSCs can serve as tumor vasculogenic stem/progenitor cells (TVPCs), and may explain why anti-angiogenic cancer therapy trials are facing challenge.


Conflict of interest statement

Competing Interests: The authors have declared that no competing interests exist.

Figures

Figure 1
Figure 1. The contribution of pCSCs to tumor vasculogenesis.
The pCSCs (clone 2C4 or 2C4G2) were inoculated s.c. or i.p. (5×10⁶/mouse; n = 10/group) into SCID mice. About 40∼100% of the mice developed tumors, which grew so fast once they were palpable that the mice had to be sacrificed within 7 d of the palpation . The tumors were harvested and fixed with 10% formalin in PBS. The sections were stained with H & E, and subjected to microscopic analysis simultaneously under the bright (A & E) and fluorescent fields (B & F), respectively (A & B). To verify the results from fluorescent microscopy, successive sections were subjected to IHC staining with rabbit mAb to GFP (1∶300 dilution) followed by HRP-conjugated goat anti-rabbit IgG (C, D, G & H). The data shown are a representative of tumor micrographs. A–D, A tumor from a mouse inoculated with GFP-expressing cells (2C4G2); the insets in C were enlarged as shown in D, demonstrating GFP-positive TVECs and RBCs. E–H, A tumor from a mouse transplanted with non-GFP-expressing cells (2C4), and the insets in G were enlarged as shown in H, demonstrating GFP-negative TVECs and RBCs. C and G are successive sections of A and E, respectively, and were stained with the same rabbit mAb to GFP. Arrows in A and E indicate the same blood vessels in B and F, respectively, which were GFP-positive or GFP-negative.
Figure 2
Figure 2. The effect of cytokines on VEGFR-2 expression in pCSCs.
The pCSCs (2C4 clone) were cultured in 2.0 ml of R10F (1×10⁵ cells/well) in 24-well plates in the presence of cytokine IL-3 (50 ng/ml), IL-4 (20 ng/ml), IL-6 (50 ng/ml); IL-7 (50 or 100 ng/ml), IL-13 (50 ng/ml), GM-CSF (40 ng/ml), or FL (200 ng/ml) alone or in combination (GM-CSF+IL-4; FL+IL-13; IL-3+IL-6). Control cultures were absent from exogenous cytokines. The cells were harvested 3 days later, stained with FITC-conjugated rat mAb to murine CD133 and PE-conjugated mAb to murine Flk-1 (VEGFR-2), and analyzed by flow cytometry . A, Data shown are contour plots of a representative experiment. The numbers in quadrants indicate the percentage of each subpopulation. B, Shown is the percentage of Flk-1+ cells of pCSCs derived from four independent experiments. **, p<0.01; * p<0.05, compared to the cultures without exogenous cytokines.
Figure 3
Figure 3. Differentiation of pCSCs in responding to hypoxia.
The pCSCs (clone 2C4; 5×10⁴/well) were cultured in 0.5 ml (hypoxia) or 2.0 ml (normoxic) of R10F medium or Matrigel. From day 3∼4 of cultures, the cells in the suspension medium or Matrigel are morphologically altered in the hypoxic culture but not in normoxic cultures (A). The cells were harvested on day 4 of cultures, enumerated (B), and analyzed for CD31 and CD45 expression by flow cytometry (C), or harvested on day 1, 2, 3 and 4 for angiogenic factor expression revealed by RT-PCR (D, day 1∼3) or real-time PCR (E, day 4). A, the phase contrast microphotographs of cell morphology of pCSCs cultured in Matrigel-containing or suspension medium under the normal or hypoxic condition, which were taken at day 4 of culture. Arrows indicate apoptotic cells. B, Hypoxia inhibited proliferation of pCSCs. Data shown are pooled results from two of four reproducible experiments (n = 4 well/group/expt). C, phenotypic analysis of the pCSCs cultured in the hypoxic condition using flow cytometry. The number in each quadrant represents the percentage of the gated live cells. D and E, Expression of vascular growth factor and endothelial cell marker genes in the pCSCs responding to hypoxia. The cells were harvested at day 1, 2, and 3 of cultures and analyzed by RT-PCR (D), or harvested at day 4 and analyzed by real-time PCR (E). Data shown are representatives from 3∼4 experiments, and the data of D was also quantitated and shown in Fig. S3.
Figure 4
Figure 4. Comparison of vasculogenic capacity between pCSCs and TMCs.
SCID mice were inoculated s.c. with pCSCs (2C4) at left groin and TMCs (3B11) at right groin (5×10⁶/mouse). Tumor incidence and size were monitored every other day (A), and pCSC- or TMC-derived blood vessels were analyzed by H & E and IHC staining of paraffin-embedded tumor sections (B), and the blood vessels in each section were counted under high power microscopy (C). Constitutive expression of angiogenesis-related genes between pCSCs and TMCs was compared before inoculation. A, tumor incidence and size: *, p<0.05; when compared between male (n = 5) and female (n = 5) mice. B, Analysis of pCSC- or TMC-derived tumor vasculature: upper panel: H. & E staining; middle panel: IHC staining specific for neomycin; and bottom panel: IHC staining controls with normal rabbit IgG as primary antibody. Arrows in the middle and bottom panels indicate neomycin-positive or negative TVECs or blood vessels at various developing stages. C, Comparison of the numbers of neomycin+ blood vessels between pCSC- and TMC-derived tumors: Neomycin+ blood vessels were counted under the 400× field of light microscope, and expressed as the number of per high-power field (HPF). Each tumor was counted for three successive sections, and 5 tumors were counted per group (**, p<0.01, as compared between pCSC and TMC-derived tumors). D, Constitutive expression of angiogenesis-related genes between pCSCs and TMCs: The 2C4 and 3B11 cells were harvested at log-phase of growth and analyzed by semiquantitative RT-PCR for 25, 30 and 35 cycles, respectively (Lane 1, 2C4; lane 2, 3B11).
Figure 5
Figure 5. Vasculogenic capacity of human tumor cell lines.
Human Leukemia/lymphoma cell line MV411 was injected s.c. into groin of SCID mice (5 ×10⁶/mouse; n = 4). MV411 developed into solid tumor palpable at day 15 of injection and the tumors were harvested 26 days after injection. The tumors were harvested for RNA extraction or fixed in 10% formaldehyde. A, Activity of TVPCs in human tumor cell lines: the sections of xenograft tumors were stained with H. & E. (a) or stained immunohistochemically with rabbit IgG (b) or rabbit anti-human CD34 (c & d), CD45 (e), CD31 (f) or VWF (g & h), followed by HRP-conjugated secondary antibody. In the d, the sections of human placenta were stained as positive control for CD34 in the same slides of c. The arrow in e indicates a CD45-negative endothelial-like cells lining on the wall of a blood vessel. Original magnification of micrographs: ×400 (numbers in the micrographs indicate real magnification shown). B & C, Expression of endothelial-related genes in the human MV411 tumor cells before (B) and after transplantation (C): Before transplantation, the MV411 and 2C4 cells were harvested at log-phase of growth, and extracted for total RNA. The mRNAs from MV411 and 2C4 cells were probed with both human and murine primers specific for CD45, CD34, CD31, VWF and β-actin mRNAs, respectively. Note that murine primers of β-actin cross-reacted to human β-actin, vice versa. The data shown are representative of three experiments. Murine 2C4 cells were used as species specific negative and positive controls for human- and murine specific primers, respectively (B). After transplantation, three MV411 cell-derived tumors were extracted for total RNA as described in A and probed with human and murine primers of CD45, CD34, CD31, VWF and β-actin, respectively. Lane 1∼3: each individual tumor; Lane 4: H2O, used for technical control for RT-PCR (C).
Figure 6
Figure 6. Defective phenotype and function of human TVECs.
The sections of human cervical (n = 25) and breast cancer (n = 5) specimens were stained immunohistochemically with mAbs to CD45, CD31, CD34, or VWF. None of the cases examined demonstrated normal profile of endothelial cell markers, and none of the markers examined was detected in all tumor blood vessels. The insets indicate CD45+ endothelial-like cells within blood vessels; and arrow heads indicate that the endothelial-like cells lining upon blood vessels did not express relevant markers examined. The data shown are representative micrographs of human cervical and breast cancer. Original magnification: ×400; final magnification shown: ×72.
Figure 7
Figure 7. The putative cellular mechanism for tumor vasculogenesis.
TVPCs within tumor cell aggregates line-up along the branching lumen (A, circles), and form tubes (A & B, green arrows). The tubes are extended, elongated, and become neo-vasculatures (C, green arrow). The newly formed vasculature (neomycin+; red arrow) merged with host blood vessels (neomycin; green arrow) to form the neo-vasculature networks (D). E, A schematic process of tumor vasculogenesis illustrated based on A∼D. The figure A is derived from a 3B11 tumor. Original magnification of micrographs: ×600.

References

    1. Bergers G, Benjamin LE. Tumorigenesis and the angiogenic switch. Nat Rev Cancer. 2003;3:401–10. - PubMed
    1. Carmeliet P, Jain RK. Angiogenesis in cancer and other diseases. Nature. 2000;407:249–57. - PubMed
    1. Folkman J. Tumor angiogenesis: therapeutic implications. N Engl J Med. 1971;285:1182–6. - PubMed
    1. Papetti M, Herman IM. Mechanisms of normal and tumor-derived angiogenesis. Am J Physiol Cell Physiol. 2002;282:C947–70. - PubMed
    1. Gao JX. Cancer stem cells: the lessons from precancerous stem cells. J Cell Mol Med. Online 2007 - PMC - PubMed

Publication types

MeSH terms

Substances