. 2008 May;291(5):475-87.
doi: 10.1002/ar.20670.

Optimization of volumetric computed tomography for skeletal analysis of model genetic organisms

Affiliations

Optimization of volumetric computed tomography for skeletal analysis of model genetic organisms

Sergio X Vasquez et al. Anat Rec (Hoboken). 2008 May.

Abstract

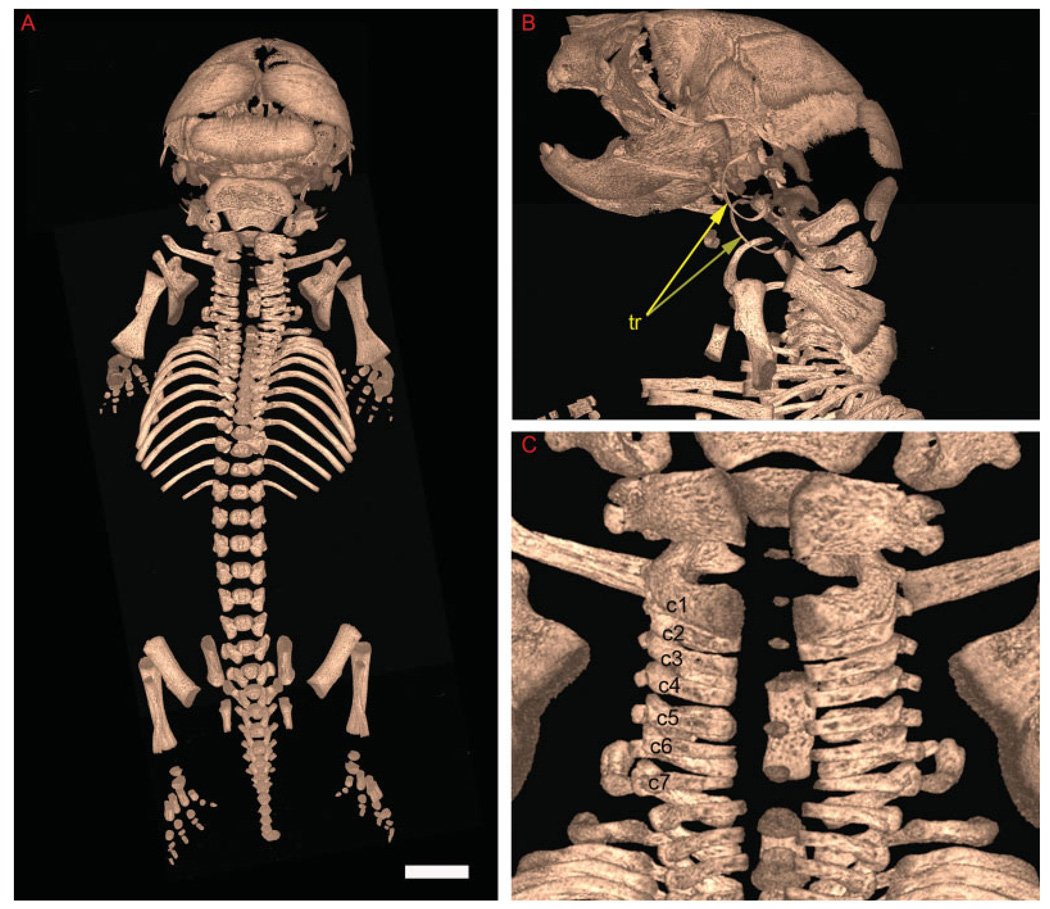
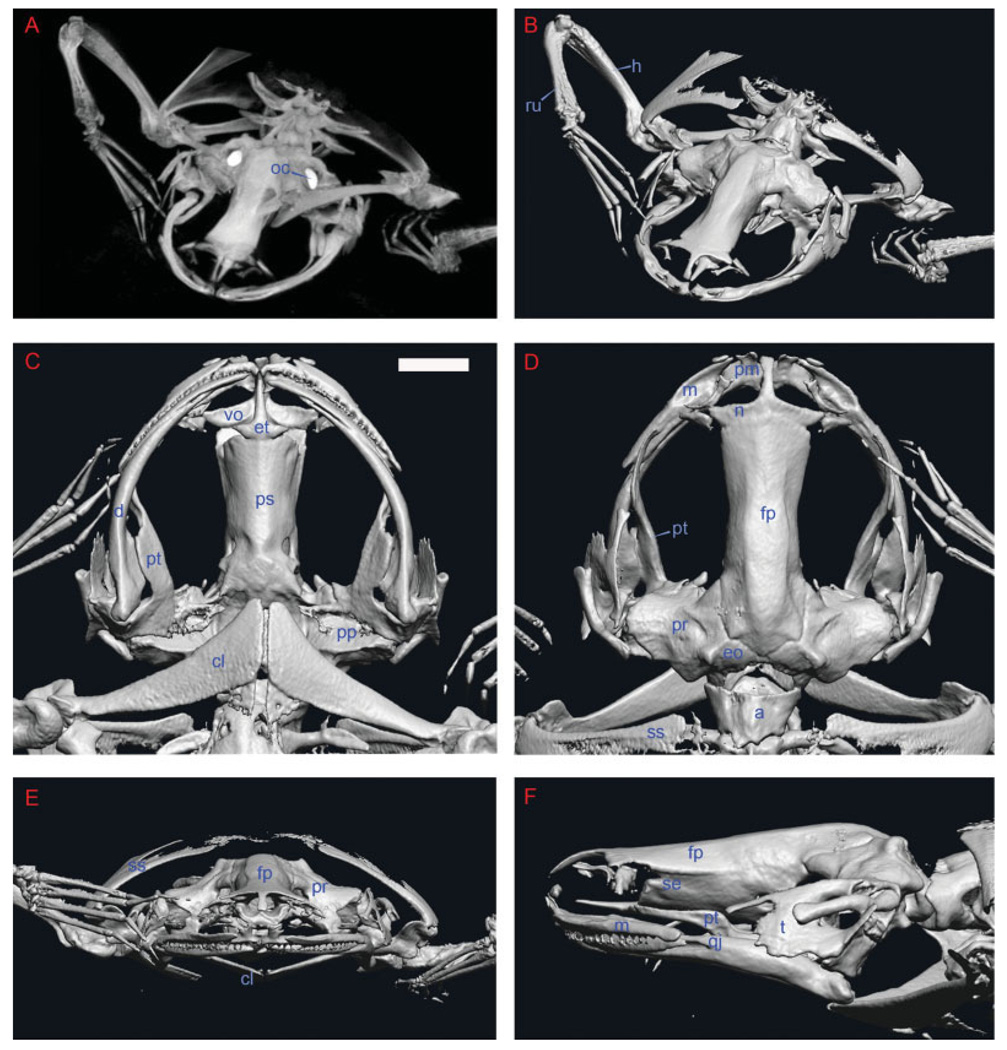
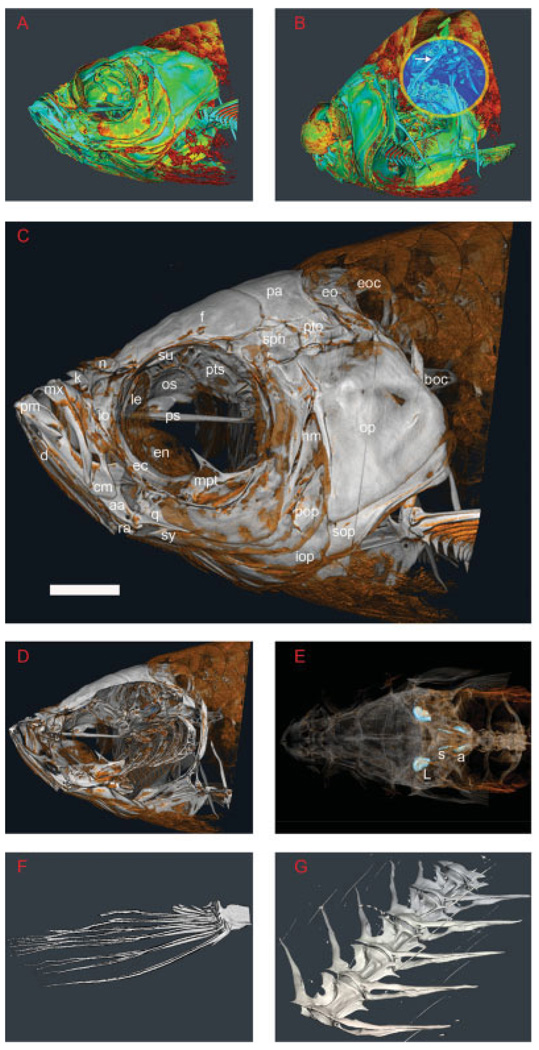
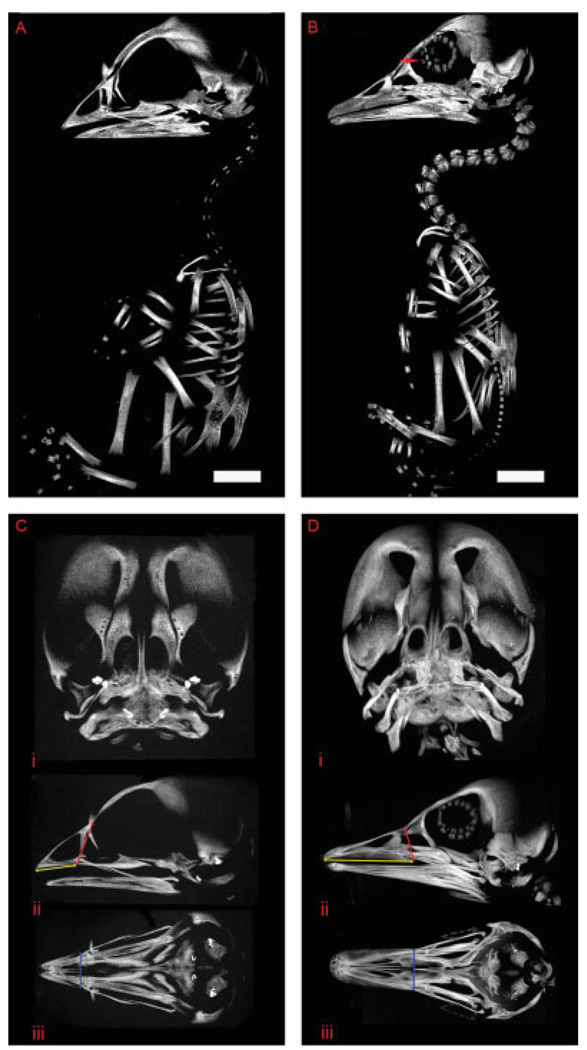
Forward and reverse genetics now allow researchers to understand embryonic and postnatal gene function in a broad range of species. Although some genetic mutations cause obvious morphological change, other mutations can be more subtle and, without adequate observation and quantification, might be overlooked. For the increasing number of genetic model organisms examined by the growing field of phenomics, standardized but sensitive methods for quantitative analysis need to be incorporated into routine practice to effectively acquire and analyze ever-increasing quantities of phenotypic data. In this study, we present platform-independent parameters for the use of microscopic x-ray computed tomography (microCT) for phenotyping species-specific skeletal morphology of a variety of different genetic model organisms. We show that microCT is suitable for phenotypic characterization for prenatal and postnatal specimens across multiple species.


Figures

Fig. 1
Fig. 1
Traditional and virtual skeletal preparations using a general purpose microCT scanner are similar for the ossified skeleton. Volume rendering of a wild-type postnatal day (P) 0 mouse fetus acquired at 10 µm under optimized parameters. A: Dorsal view. B: Dorsal close-up of mouse cervical vertebrae. C: Close-up of left lateral aspect of mouse skull. Both left and right tympanic rings (tr) are seen in the rendering (yellow arrows). Cervical vertebrae 1–7 are noted (c1–c7). Scale bar = 1.5 mm.
Fig. 2
Fig. 2
Nonmammalian genetic model organisms are amenable to phenotyping by microCT. Whole specimen skeletal analysis of African clawed frog, Xenopus laevis. A: Oblique dorsal maximal intensity projection of a 93-µm focal spot width scan of specimen. Orientation is such that the observer is looking at the frog in a dorsal position, with only the upper third of the specimen in view. The bright, symmetric, electron-dense structures are the otic capsules (oc). B: Oblique volume rendering of specimen data in the same orientation as in A. The fused radioulnar (ru) of the frog arm has been demarcated to illustrate this unique skeletal feature of Anurans. C: Ventral view. D: Dorsal view. The frontoparietal bone (fp) of the skull, also fused in Anurans, is demarcated. E: Axial view. F: Left lateral view. a, atlas; cl, clavicle; d, dentary; eo, exoccipital; et, ethmoid; h, humerus; m, maxillary; n, nasal; pm, premaxillary; pt, pterygoid; qj, quadratojugal; se, sphenethmoid; ss, suprascapular; t, tympanum; vo, vomer. Scale bar = 3.6 mm.
Fig. 3
Fig. 3
Advanced rendering algorithms, combined with a higher resolution scanning instrument allow for zebrafish phenotyping. Whole specimen skeletal analysis of adult zebrafish, Danio rerio, at 6-µm focal spot width. A: Volumetric two-dimensional transfer function rendering of the zebrafish cranium. Renderings such as this left sagittal view of the zebrafish skull help the observer appreciate edge boundaries. B: Rendering of zebrafish cranium in the oblique caudal view. The Weberian apparatus, a negative pressure adaptation used in predator detection, is highlighted (white arrow in blue focus ring). C: Pseudocolored rendering of the left lateral aspect of the zebrafish skull. D: Noninvasive cross-sectional rendering of the zebrafish skull. E: Dorsal aspect of the zebrafish, anterior to the left. The bright blue nodules represent the lapillus (L), sagitta (s), and asteriscus (a) (the anterior, medial, and posterior otoliths, respectively) of the adult zebrafish ear. F: Rendering of the pectoral fin. The fine structure of the fin bones can be seen despite their inherently small size. G: A rendered portion of the ventral aspect of the zebrafish spine showing articulation of individual spinal segments. aa, anguloarticular; boc, basioccipital; cm, coronomeckelian; d, dentary; ec, ectopterygoid; en, entopterygoid; eo, epioccipital; eoc, exoccipital; f, frontal; hm, hyomandibula; io, infraorbital; iop, interopercle; k, kinethmoid; le, lateral ethmoid; mpt, metapterygoid; mx, maxilla; n, nasal; op, opercle; os, orbitosphenoid; pa, parietal; pm, premaxilla; pop, preopercle; ps, parasphenoid; pto, pterotic; pts, pterosphenoid; q, quadrate; ra, retroarticular; soc, supraoccipital; sop, subopercle; sph, sphenotic; su, supraorbital; sy, symplectic. (After Cubbage and Mabee, 1996.) Scale bar = 0.5 mm.
Fig. 4
Fig. 4
Anatomical landmarks of avian species can be identified and measured accurately for comparative studies. Whole specimen skeletal analysis of domestic chick at a 30-µm focal spot width and duck at a 36-µm focal spot width. A: Rendering of the fetal domestic chicken, Gallus domesticus, at embryonic day (E) 14, left lateral view. B: Rendering of the fetal domestic duck, Anas domesticus, at developmental day E19, left lateral view. Red arrow denotes the scleral ring. Ci: A coronal maximum intensity projection (MIP) of the fetal chick skull. ii: Left lateral MIP of the fetal chick skull showing beak length (yellow double arrow) and height (red double arrow) landmark measurements. iii: Ventral MIP of fetal chick skull showing beak width (blue double arrow) landmark measurement. Di: Coronal MIP of the fetal duck skull. ii: Left lateral MIP of the fetal duck skull showing beak length (yellow double arrow) and height (red double arrow) measurements. iii: Ventral MIP of fetal duck skull showing beak width (blue double arrow) landmark measurement. Scale bar = 4.6 mm in A, 7.0 mm in B.
Fig. 5
Fig. 5
Morphological areas can be analyzed without destructively altering the natural position of the skeleton. Gross and microCT analysis, pelvis and femur of a skeletal preparation of little brown bat, Myotis lucifugus. A: Darkfield microscopy of bat pelvis, cleared skeleton preparation. B: A maximum intensity projection of 46 µm scan of bat pelvis. Visible are the linea aspire (la), to which muscles attach, and the greater trochanter (gt), a feature of the proximal femur. C: Darkfield microscopy of the disarticulated femoral head. D: Rendering of 12 µm scan of the articulated femoral head (i.e., the scan was cropped, but the specimen bone was intact in the socket during the scan). Pelvis has been cropped out of the image for viewing of femoral features. E: Darkfield microscopy of the disarticulated bat pelvis. F: Rendering of a 12-µm scan of the articulated pelvis. Femur has been cropped out of the image for viewing of pelvic features. ac, acetabulum; fcf, fovea capitis femoris; h, head (of femur); il, ileum; is, ischium; itc, intertrochanteric crest; lt, lesser trochanter; mc, marrow cavity; n, neck (of femur); pu, pubis. Scale bar = 6.0 mm in A, 0.5 mm in C, 2.0 mm in E.
Fig. 6
Fig. 6
Multispecies skeletal data can be compared in parallel using microCT. Comparative skeletal data from opossum, mouse, bat, and lemur. A: Rendering of Monodelphis domestica, the laboratory opossum, a 93-µm focal spot width, whole specimen scan. I: A maximum intensity projection (MIP) of the opossum skull. Brightest areas indicate areas of greatest bone density (e.g., teeth, semicircular canals of the inner ear). B: A rendering of Mus musculus, the laboratory mouse, a 93-µm focal spot width, whole specimen scan. II: MIP of the mouse skull. C: A rendering of Myotis lucifugus, the little brown bat, a 46-µm focal spot width, skeletal preparation. III: MIP of the bat skull. D: A rendering of Microcebus murinus, the mouse lemur, a 93-µm focal spot width, whole specimen scan. IV: MIP of the lemur skull. V: A rendering of a 93-µm scan of the lemur skull, included for direct comparison between a MIP and a volume rendering. Scale bar = 8.6 mm in A,B, 4.6 mm in C, 8.0 mm in D.
Fig. 7
Fig. 7
Quantitative multi-species limb analysis performed using microCT data. A: Limb lengths of humerus, radius, femur, and tibia of respective model organisms. Lengths (in mm) are shown at bottom. B: Average cortical thickness, midshaft. C: Average bone mineral densities, midshaft.

References

    1. Abzhanov A, Protas M, Grant BR, Grant PR, Tabin CJ. Bmp4 and morphological variation of beaks in Darwin’s finches. Science. 2004;305:1462–1465. - PubMed
    1. Attwood D. Microscopy: nanotomography comes of age. Nature. 2006;442:642–643. - PubMed
    1. Austin CP, Battey JF, Bradley A, Bucan M, Capecchi M, Collins FS, Dove WF, Duyk G, Dymecki S, Eppig JT, Grieder FB, Heintz N, Hicks G, Insel TR, Joyner A, Koller BH, Lloyd KC, Magnuson T, Moore MW, Nagy A, Pollock JD, Roses AD, Sands AT, Seed B, Skarnes WC, Snoddy J, Soriano P, Stewart DJ, Stewart F, Stillman B, Varmus H, Varticovski L, Verma IM, Vogt TF, von Melchner H, Witkowski J, Woychik RP, Wurst W, Yancopoulos GD, Young SG, Zambrowicz B. The knockout mouse project. Nat Genet. 2004;36:921–924. - PMC - PubMed
    1. Belov K, Sanderson CE, Deakin JE, Wong ES, Assange D, McColl KA, Gout A, de Bono B, Barrow AD, Speed TP, Trowsdale J, Papenfuss AT. Characterization of the opossum immune genome provides insights into the evolution of the mammalian immune system. Genome Res. 2007;17:982–991. - PMC - PubMed
    1. Beltran WA, Vanore M, Ollivet F, Nemoz-Bertholet F, Aujard F, Clerc B, Chahory S. Ocular findings in two colonies of gray mouse lemurs (Microcebus murinus) Vet Ophthalmol. 2007;10:43–49. - PubMed

Publication types