. 2008 Mar 4;105(9):3203-8.
doi: 10.1073/pnas.0706795105. Epub 2008 Feb 14.

Imaging the impact on cuprate superconductivity of varying the interatomic distances within individual crystal unit cells

Affiliations

Imaging the impact on cuprate superconductivity of varying the interatomic distances within individual crystal unit cells

J A Slezak et al. Proc Natl Acad Sci U S A. .

Abstract

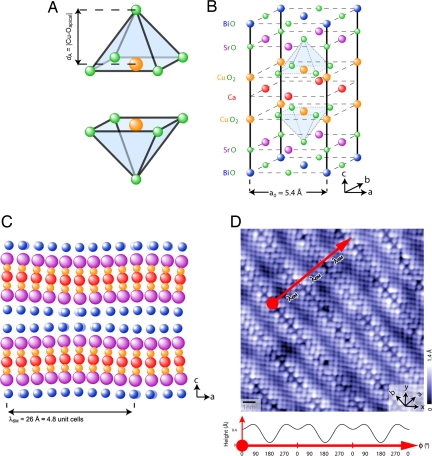
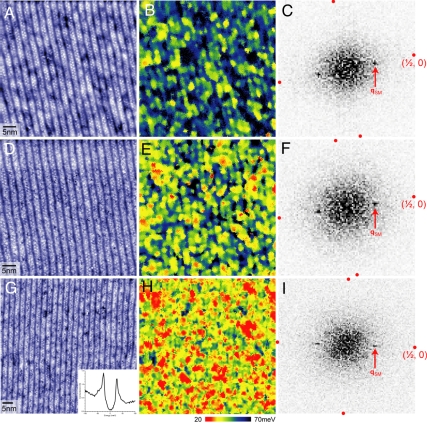
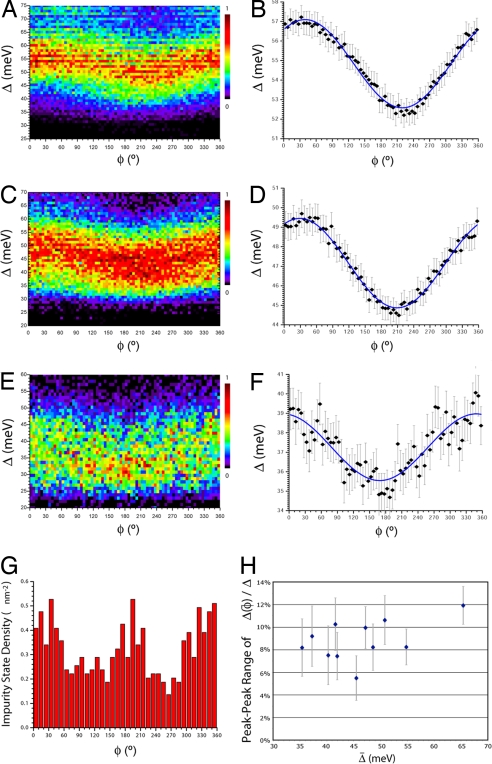
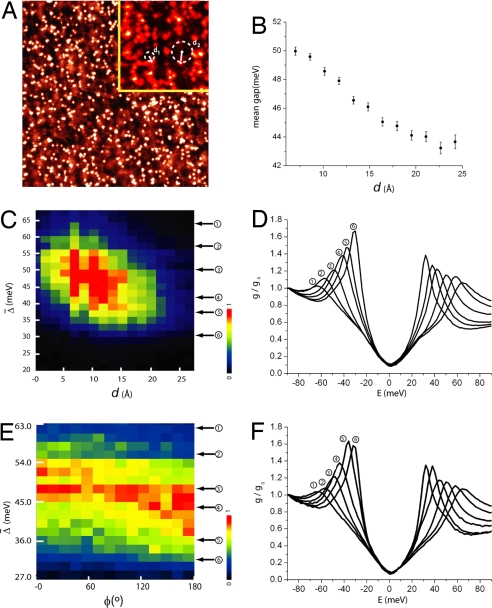
Many theoretical models of high-temperature superconductivity focus only on the doping dependence of the CuO(2)-plane electronic structure. However, such models are manifestly insufficient to explain the strong variations in superconducting critical temperature, T(c), among cuprates that have identical hole density but are crystallographically different outside of the CuO(2) plane. A key challenge, therefore, has been to identify a predominant out-of-plane influence controlling the superconductivity, with much attention focusing on the distance d(A) between the apical oxygen and the planar copper atom. Here we report direct determination of how variations in interatomic distances within individual crystalline unit cells affect the superconducting energy-gap maximum Delta of Bi(2)Sr(2)CaCu(2)O(8+delta). In this material, quasiperiodic variations of unit cell geometry occur in the form of a bulk crystalline "supermodulation." Within each supermodulation period, we find approximately 9 +/- 1% cosinusoidal variation in local Delta that is anticorrelated with the associated d(A) variations. Furthermore, we show that phenomenological consistency would exist between these effects and the random Delta variations found near dopant atoms if the primary effect of the interstitial dopant atom is to displace the apical oxygen so as to diminish d(A) or tilt the CuO(5) pyramid. Thus, we reveal a strong, nonrandom out-of-plane effect on cuprate superconductivity at atomic scale.


Conflict of interest statement

The authors declare no conflict of interest.

Figures

Fig. 1.
Fig. 1.
Crystal structure and periodic unit cell distortion due to bulk incommensurate supermodulation. (A) The CuO5 pyramidal coordination of oxygen atoms surrounding each copper atom in Bi2Sr2CaCu2O8+δ. (B) Top half of the Bi2Sr2CaCu2O8+δ unit cell (the lower half is identical except for a translation by a0/2 along the a axis). Crystal axes a, b, and c are indicated. (C) Schematic view along the b axis of the crystal, showing representative displacements of all non-O atoms (adapted from ref. 14). Supermodulation displacements can be seen in both the a and c directions. (D) A 14.6-nm-square topographic image of the exposed BiO layer of a cleaved crystal of Bi2Sr2CaCu2O8+δ. The x and y axes (aligned along the Cu–O bonds), and the crystalline a and b axes, are indicated in the figure. The c axis supermodulation effect is visible as corrugations of the surface. A simulated cross-section is shown, illustrating the periodic profile of the modulations. [Profile calculated by phase-averaging the topographic height and fitting the first two harmonics of the resulting function z(φ).]
Fig. 2.
Fig. 2.
Appearance of gap modulations at the same wavevector qSM as the crystal supermodulation. Topographic images of underdoped (mean gap, 5 meV) (A), optimally doped (mean gap, 47 meV) (D), and overdoped (mean gap, 37 meV) (G) samples of Bi2Sr2CaCu2O8+δ. Gap maps B, E, and H correspond to adjacent topographs A, D, and G, respectively, alongside their respective Fourier transforms C, F, and I. Clear peaks are visible in the Fourier-transformed gap maps at qSM (indicated). Points corresponding to (±½, 0) and (0, ±½) are indicated, in units of 2π/a0.
Fig. 3.
Fig. 3.
Gap magnitude as a function of crystal supermodulation phase. (A, C, and E) Two-dimensional histograms giving the frequency with which each value of Δ (in meV) occurs at a given phase of the supermodulation φ (in degrees) for the underdoped (A), optimally doped (C), and overdoped (E) samples analyzed in Fig. 2. The color scale gives the relative frequency as a fraction of the maximum. Taking any vertical cut through these two-dimensional histograms results in an approximately Gaussian-profiled one-dimensional histogram of Δ distribution for a specific value of φ. (B, D, and F) The mean value of Δ for each value of φ is plotted as a function Δ(φ) for each sample from A, C, and E, respectively. Error bars represent 95% confidence intervals. (G) Dopant impurity state density vs. supermodulation phase, showing a typical two-peaked distribution. (H) The magnitude of the supermodulation effect on gap energy is represented by the peak-to-peak range 2A of the cosinusoidal fit to Δ(φ) (expressed as a percentage of the average) for each sample studied. There is no clear relationship to the hole density.
Fig. 4.
Fig. 4.
Response of gap to interstitial dopant ions and supermodulation. (A) A dI/dV(r, V) map at V = −0.96 V, showing locations of dopant ions. Inset, two examples of the definition of d, the distance from any point to the nearest dopant atom. (B) Mean gap value as a function of d. (C) Histogram of gap values vs. d. (D) Average spectra associated with different nearest-dopant-atom distances, as labeled in C. (E) Gap magnitudes sorted by the phase of the supermodulation. (F) Average spectra associated with different values of supermodulation phase, as labeled in E. We emphasize that the spectra in D and F are not sorted by gap values. The arrows in C and E are merely guides to indicate the resulting average gap values after the spectra are sorted by d and φ, respectively.

Comment in

  • Modulated pairs in superconducting cuprates.
    Norman MR. Norman MR. Proc Natl Acad Sci U S A. 2008 Mar 4;105(9):3173-4. doi: 10.1073/pnas.0800433105. Epub 2008 Feb 27. Proc Natl Acad Sci U S A. 2008. PMID: 18305153 Free PMC article. No abstract available.

References

    1. Eisaki H, et al. Effect of chemical inhomogeneity in bismuth-based copper oxide superconductors. Phys Rev B Condens Matter. 2004;69 064512.
    1. Ohta Y, Tohyama T, Maekawa S. Apex oxygen and critical temperature in copper oxide superconductors: Universal correlation with the stability of local singlets. Phys Rev B Condens Matter. 1991;43:2968–2982. - PubMed
    1. Maekawa S, et al. Physics of Transition Metal Oxides. New York: Springer; 2004. Chap 1.
    1. Attfield JP, Kharlanov AL, McAllister JA. Cation effects in doped La2CuO4 superconductors. Nature. 1998;394:157–159.
    1. Fujita K, Noda T, Kojima KM, Eisaki H, Uchida S. Effect of disorder outside the CuO2 planes on Tc of copper oxide superconductors. Phys Rev Lett. 2005;95 097006. - PubMed

Publication types