Comparative Study
. 2008 Feb 26;105(8):2946-50.
doi: 10.1073/pnas.0712259105. Epub 2008 Feb 14.

MicroRNAs and the advent of vertebrate morphological complexity

Affiliations
Comparative Study

MicroRNAs and the advent of vertebrate morphological complexity

Alysha M Heimberg et al. Proc Natl Acad Sci U S A. .

Abstract

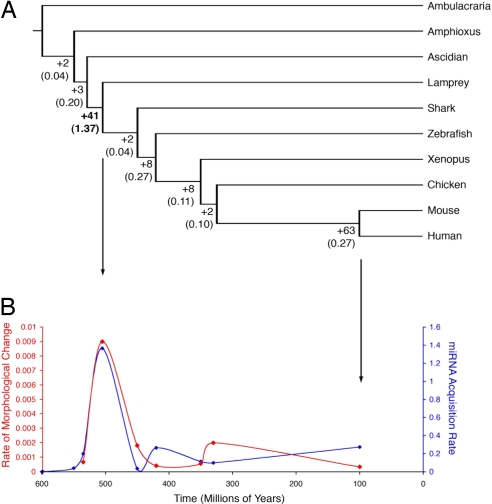
The causal basis of vertebrate complexity has been sought in genome duplication events (GDEs) that occurred during the emergence of vertebrates, but evidence beyond coincidence is wanting. MicroRNAs (miRNAs) have recently been identified as a viable causal factor in increasing organismal complexity through the action of these approximately 22-nt noncoding RNAs in regulating gene expression. Because miRNAs are continuously being added to animalian genomes, and, once integrated into a gene regulatory network, are strongly conserved in primary sequence and rarely secondarily lost, their evolutionary history can be accurately reconstructed. Here, using a combination of Northern analyses and genomic searches, we show that 41 miRNA families evolved at the base of Vertebrata, as they are found and/or detected in lamprey, but not in either ascidians or amphioxus (or any other nonchordate taxon). When placed into temporal context, the rate of miRNA acquisition and the extent of phenotypic evolution are anomalously high early in vertebrate history, far outstripping any other episode in chordate evolution. The genomic position of miRNA paralogues in humans, together with gene trees incorporating lamprey orthologues, indicates that although GDEs can account for an increase in the diversity of miRNA family members, which occurred before the last common ancestor of all living vertebrates, GDEs cannot account for the origin of these novel families themselves. We hypothesize that lying behind the origin of vertebrate complexity is the dramatic expansion of the noncoding RNA inventory including miRNAs, rather than an increase in the protein-encoding inventory caused by GDEs.


Conflict of interest statement

The authors declare no conflict of interest.

Figures

Fig. 1.
Fig. 1.
miRNA discovery in lamprey and shark using mir-205 as an example. (A) Northern analysis. miR-205 is clearly detected in all vertebrates examined [brook lamprey, Lampetra planeri (Lpl); cat shark, Scyliorhinus canicula (Sca); zebrafish, Danio rerio (Dre); mouse, Mus musculus (Mmu)], but not in any invertebrate including the hemichordate Ptychodera flava (Pfl), the cephalochordate Branchiostoma floridae (Bfl), and the ascidian Ciona intestinalis (Cin). However, more primitive miRNAs, including miR-1, are clearly detected in all samples. (B) Alignment of the stem-loop sequence for mir-205 from nine vertebrates. Two copies of mir-205 were found in the sea lamprey Petromyzon marinus (Pma), and a single copy was found in the genomic traces of the elephant shark Callorhinchus milii (Cmi). All three regions of a miRNA gene (the mature sequences, the star sequences, and the loop region) are clearly discernable from the alignment. (C) Predicted secondary structure of the mir-205 orthologue from Pma-2 (Upper) and Cml (Lower) as determined by Mfold (42). The initial ΔG values for formation are −44.1 and −36.4 kcal/mol, respectively. Other abbreviations: Hsa, Homo sapiens; Gga, Gallus gallus; Xtr, Xenopus tropicalis; Tru, Tetrafugu rubipes; Tni, Tetraodon nigroviridis.
Fig. 2.
Fig. 2.
Distribution of miRNAs across Deuterostomia. miRNAs discovered by genomic searches (and in many cases confirmed by Northern analyses; see Table 1) are indicated by a black dot. Those not found in the genome of the indicated taxon, but detected in a total RNA preparation, are indicated by gray circles. miRNAs not found in the genome and not detected by Northern analysis are indicated by white circles. As expected (17), miRNAs, once evolved, are rarely secondarily lost and the mature sequence rarely changes in primary sequence, allowing for an accurate reconstruction of the miRNA complement of the last common ancestor. The few instances of potential secondary loss often involve miRNAs that were not detectable by Northern analysis (plain text, e.g., mir-135) and/or in taxa not yet explored by experimental means (plain text, e.g., the chicken Gallus gallus). miRNAs and taxa in bold were explored by Northern analysis. miRNA families are given by the lowest numbered member; for the full complement of miRNA members for each family see Table 1.
Fig. 3.
Fig. 3.
Evolutionary history of the 129 chordate-specific families of miRNAs found in eutherian mammals. (A) Cladogram derived from the history of miRNA family acquisition, with the number of new families (Table 1) indicated at the node and the rate of acquisition (number of new families per million years) shown parenthetically. Divergence times taken from estimates were derived from a molecular clock analysis (26) and the fossil record (44). (B) miRNA family acquisition rate (blue) plotted with rate of morphological change (2) (red) against absolute time. The spike for both miRNA acquisition and MCI are both outliers as compared with any other time in vertebrate history, as determined by a Dixon's D test. Points along the curves are tied to the nodes in A (two of which are indicated by arrows).
Fig. 4.
Fig. 4.
Fixation of vertebrate-specific miRNA families preceded the GDEs, which preceded the divergence between lamprey and gnathostomes. (A) Two of the reconstructed paleochromosomes of the ancestral osteichthyan, as determined by Kohn et al. (32), with their paralogous miRNA sets. miRNAs indicated in bold were found in the lamprey genome and phylogentically group with the indicated miRNA (B–D). (B–D) Midpoint-rooted distance trees (see Materials and Methods) of the indicated miRNA with the human, shark, and lamprey paralogues. Bootstrap values (1,000 replications) are indicated at the nodes. Note that lamprey has both paralogues of each of these three families. (E) Midpoint rooted distance phylogram of mir-196. Two copies were found in the lamprey genome, and both group with mir-196b, which is located in the HoxA cluster and reconstructed as part of paleochromosome 7 (brown; ref. 23), suggesting a tandem duplication of the miRNA, if not the entire cluster, in the lamprey lineage. No paralogues were found that group with the HoxB-associated (light blue) or HoxC-associated (light green) mir-196s. Both of these results are consistent with what is known about the evolution of the Hox clusters themselves in the lamprey lineage (34).

Similar articles

Cited by

References

    1. Valentine JW, Collins AG, Meyer CP. Morphological complexity increase in metazoans. Paleobiology. 1994;20:131–142.
    1. Aburomia R, Khaner O, Sidow A. Functional evolution in the ancestral lineage of vertebrates or when genomic complexity was wagging its morphological tail. J Struct Funct Genomics. 2003;3:45–52. - PubMed
    1. Ohno S. Evolution by Gene Duplication. Heidelberg: Springer; 1970.
    1. Holland PWH, Garcia-Fernàndez J, Williams, Nic A, Sidow A. In: The Evolution of Developmental Regulatory Mechanisms. Akam M, Holland P, Ingham P, Wray G, editors. Cambridge, UK: The Company of Biologists Limited; 1994. pp. 125–133.
    1. Sidow A. Genome duplications in the evolution of early vertebrates. Curr Opin Genet Dev. 1996;6:715–722. - PubMed

Publication types