Comparative Study
. 2008 Feb 26;105(8):3076-81.
doi: 10.1073/pnas.0708931105. Epub 2008 Feb 19.

Asymmetric segregation of protein aggregates is associated with cellular aging and rejuvenation

Affiliations
Comparative Study

Asymmetric segregation of protein aggregates is associated with cellular aging and rejuvenation

Ariel B Lindner et al. Proc Natl Acad Sci U S A. .

Abstract

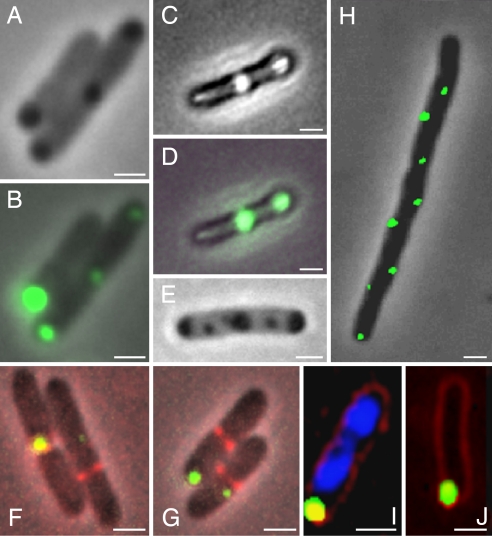
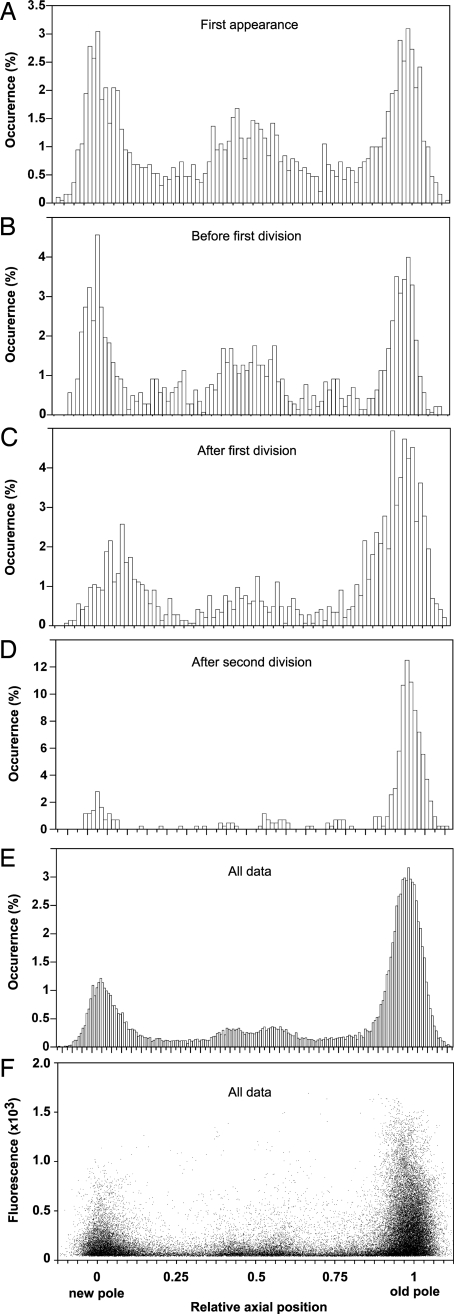
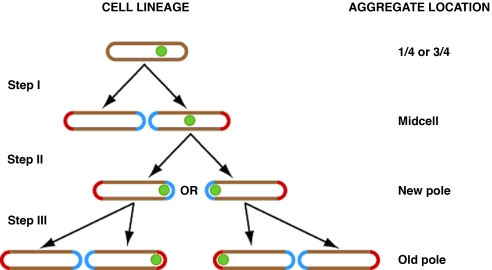
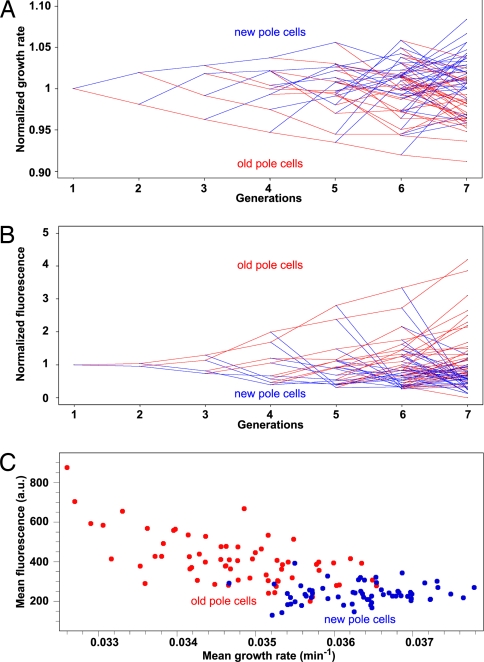
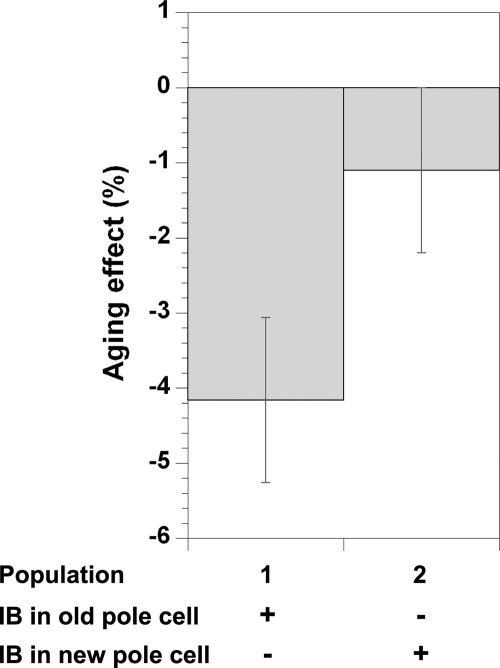
Aging, defined as a decrease in reproduction rate with age, is a fundamental characteristic of all living organisms down to bacteria. Yet we know little about the causal molecular mechanisms of aging within the in vivo context of a wild-type organism. One of the prominent markers of aging is protein aggregation, associated with cellular degeneracy in many age-related diseases, although its in vivo dynamics and effect are poorly understood. We followed the appearance and inheritance of spontaneous protein aggregation within lineages of Escherichia coli grown under nonstressed conditions using time-lapse microscopy and a fluorescently tagged chaperone (IbpA) involved in aggregate processing. The fluorescent marker is shown to faithfully identify in vivo the localization of aggregated proteins, revealing their accumulation upon cell division in cells with older poles. This accretion is associated with >30% of the loss of reproductive ability (aging) in these cells relative to the new-pole progeny, devoid of parental inclusion bodies, that exhibit rejuvenation. This suggests an asymmetric strategy whereby dividing cells segregate damage at the expense of aging individuals, resulting in the perpetuation of the population.


Conflict of interest statement

The authors declare no conflict of interest.

Figures

Fig. 1.
Fig. 1.
IbpA-YFP in vivo localization. IbpA-YFP overlaps with inclusion bodies and is independent of division machinery or nucleoid occlusion. (A) Representative phase contrast image of MGAY cells after treatment with streptomycin. (B) Overlay of A with the fluorescence image (IbpA-YFP depicted in green). (C) Representative phase contrast image of MGAY cell in the presence of an insoluble protein [antibody single-chain Fv fragment plasmidic expression (38)]. (D) Overlay of C with the fluorescence image. Similar inclusion body and IbpA-YFP colocalization was observed upon heat shock (data not shown). (E) Representative phase contrast image of MG1655(ibp::cat) cell after treatment with streptomycin. (F and G) IbpA-YFP foci are localized in cellular poles or near formed septums, visualized by expression of the ftsZ-CFP fusion (depicted in red) in the MGAY strain. (H) IbpA-YFP foci in the MGAY(minCD) strain lacking the ability to localize the division septum to mid-cell. (I) IbpA-YFP foci in the MGAY strain (blue, DAPI DNA stain; red, FM4-64 membrane stain). (J) IbpA-YFP foci in 2-aminopurine-treated dam strain where the chromosomes were degraded [blue, DAPI stain (none detected); red, FM4-64). Images were taken using 5% (B, D, and F–H) and 100% (I and J) of available excitation light. (Scale bars: 1 μm.)
Fig. 2.
Fig. 2.
Aggregate distribution and associated fluorescence levels along the cell axis. Shown is IbpA-YFP foci localization along the cells' normalized longitude internal coordinate, oriented from the new pole (0) to the old pole (1) of each cell. Binned histograms show foci localization (A–D, 100 bins; E, 200 bins) at first appearance (A), at the last movie frame before first division (B), at the first movie frame after first division (C), at the first movie frame after two consecutive divisions (D), and cumulative over all movies' frames (E). (F) Foci maximal fluorescence intensity (arbitrary gray-level units) as a function of their localization.
Fig. 3.
Fig. 3.
Individual aggregates are located to the old pole through cycles of cell divisions. Because movement of foci is rarely observed, the location of an aggregate within the cell after division is determined by its location in the mother cell. Those that were at the one- or three-quarter positions are found concentrated around the mid-cell point after division (Step I). Aggregates at the mid-cell are subsequently located in the new pole, with equal probability to be in either of the two cells (Step II). Those that are found in the new-pole end of the cell immediately before division remain in the same pole; however, that pole, having been formed in the previous division event, is now an old pole in the offspring cell (Step III). Note that aggregates can be initially detected at polar, mid-cell, or quarter-cell positions but are eventually located to an old pole. Once there, they are consistently inherited by the old-pole cell after division. Aggregates are indicated by green dots. Red cell ends are old poles, and blue cell ends are new poles.
Fig. 4.
Fig. 4.
Growth rate and aggregation accumulation in bacterial lineages. Bacterial lineage representation of average growth rates (A) and fluorescence intensity (B) of new-pole cells (blue) and old-pole cells (red) of the MGAY strain. Summits represent the measured value, and lines follow the lineage propagation. Values of the ordinates are normalized by the generation mean value and averaged over all 12 films. (A) A clear pattern of gradual loss of growth rate of old-pole cells and fast recovery of new-pole cells is discerned. In 90.5% of offspring cell pairs the old-pole cell grows more slowly than the new-pole cell and its mother cell (79.4%) (aging), whereas in 74.6% the new-pole cell grows faster than its mother cell (rejuvenation). (B) Net fluorescence intensity of foci at first time point after division. (C) The above patterns result in a negative correlation between the cells' growth rate and aggregate load (measured as foci fluorescence) whereby the two subpopulations [old-pole cells (red) and new-pole cells (blue)] can be discerned.
Fig. 5.
Fig. 5.
Aging correlation with presence of protein aggregation. The aging effect calculated from the relative growth rate (GR) difference between old-pole and new-pole offspring [e.g., (GRoldGRnew)/GRoffspring] of newborn mother cells where inclusion body is inherited by the old-pole cell (population 1) or the new-pole cell (population 2). See Table 1 for actual values. IB, inclusion bodies.

References

    1. Stewart EJ, Madden R, Paul G, Taddei F. Aging and death in an organism that reproduces by morphologically symmetric division. PLoS Biol. 2005;3:e45. - PMC - PubMed
    1. Kirkwood TB. Understanding the odd science of aging. Cell. 2005;120:437–447. - PubMed
    1. Kirkwood TB. Asymmetry and the origins of ageing. Mech Ageing Dev. 2005;126:533–534. - PubMed
    1. Ackermann M, Chao L, Bergstrom CT, Doebeli M. On the evolutionary origin of aging. Aging Cell. 2007;6:235–244. - PMC - PubMed
    1. Dobson CM. The structural basis of protein folding and its links with human disease. Philos Trans R Soc London B. 2001;356:133–145. - PMC - PubMed

Publication types

MeSH terms

Substances

Associated data