. 2008 May;82(9):4308-19.
doi: 10.1128/JVI.01447-07. Epub 2008 Feb 20.

Inhibition of CD1 antigen presentation by human cytomegalovirus

Affiliations

Inhibition of CD1 antigen presentation by human cytomegalovirus

Martin J Raftery et al. J Virol. 2008 May.

Abstract

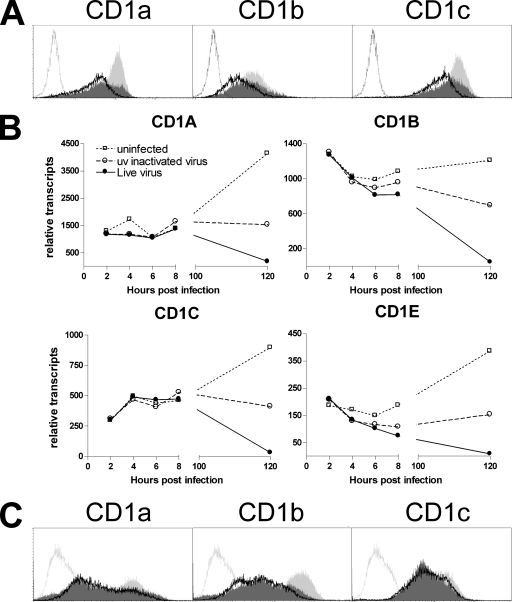
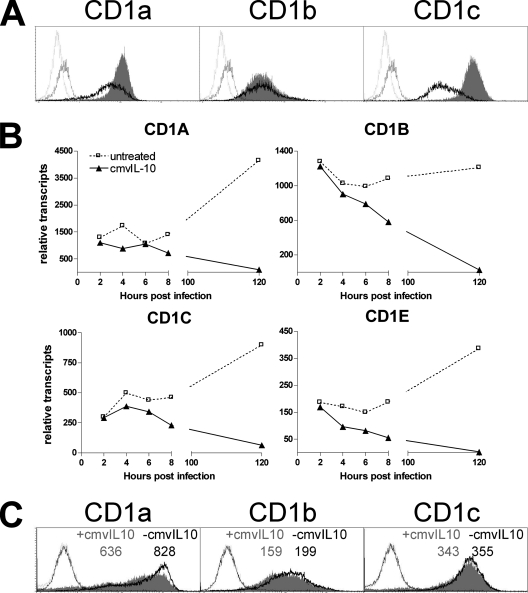
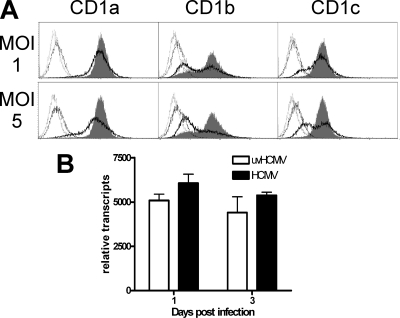
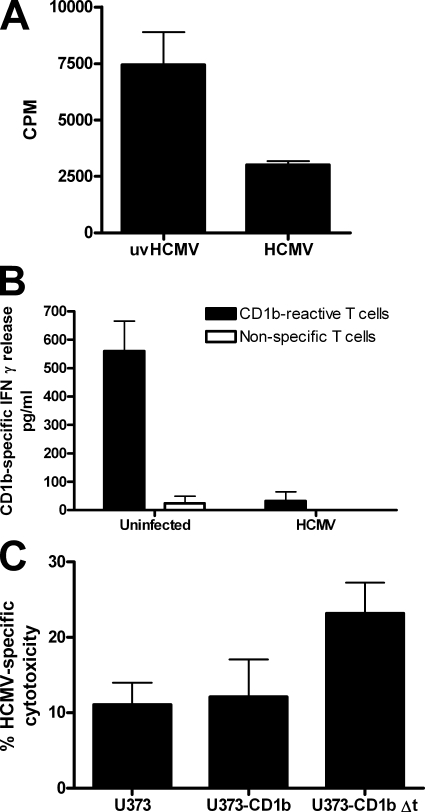
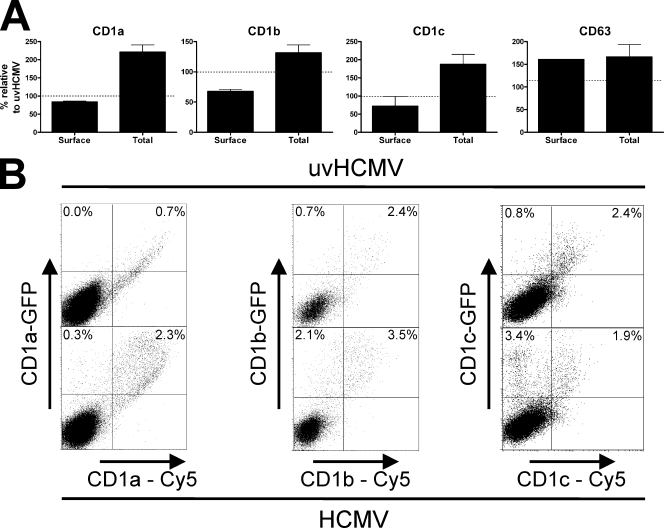
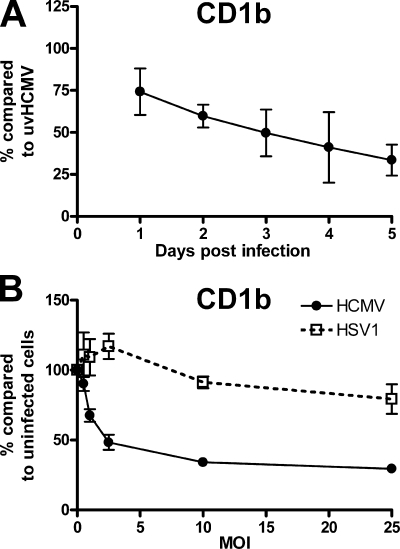
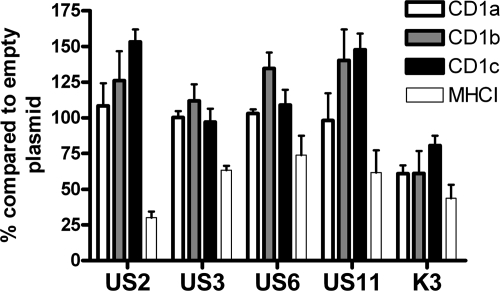
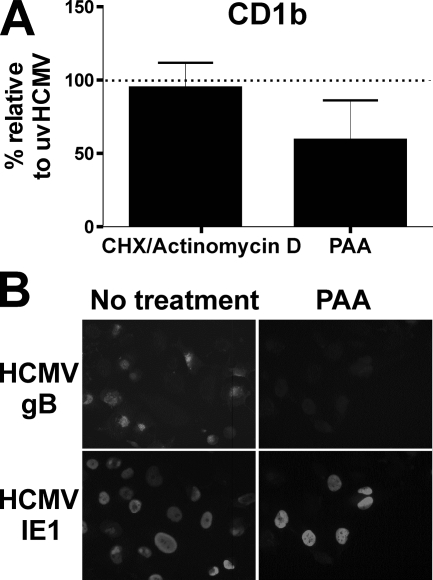
The betaherpesvirus human cytomegalovirus (HCMV) encodes several molecules that block antigen presentation by the major histocompatibility complex (MHC) proteins. Humans also possess one other family of antigen-presenting molecules, the CD1 family; however, the effect of HCMV on CD1 expression is unknown. The majority of CD1 molecules are classified on the basis of homology as group 1 CD1 and are present almost exclusively on professional antigen-presenting cells such as dendritic cells, which are a major target for HCMV infection and latency. We have determined that HCMV encodes multiple blocking strategies targeting group 1 CD1 molecules. CD1 transcription is strongly inhibited by the HCMV interleukin-10 homologue cmvIL-10. HCMV also blocks CD1 antigen presentation posttranscriptionally by the inhibition of CD1 localization to the cell surface. This function is not performed by a known HCMV MHC class I-blocking molecule and is substantially stronger than the blockage induced by herpes simplex virus type 1. Antigen presentation by CD1 is important for the development of the antiviral immune response and the generation of mature antigen-presenting cells. HCMV present in antigen-presenting cells thus blunts the immune response by the blockage of CD1 molecules.


Figures

FIG. 1.
FIG. 1.
Reduced CD1 expression on DC post-HCMV infection. (A and B) Human DC generated from monocytes were infected with HCMV strain NEWT at a MOI of 3, mock infected with UV-inactivated HCMV, or not infected before incubation for 3 days and analysis for group 1 CD1 molecules by flow cytometry (A) or qRT-PCR (B). The unfilled solid-line curves represent data for live HCMV-infected DC, the dark gray filled curves represent data for UV-inactivated HCMV-treated DC, and the light gray filled curves represent data for uninfected DC. The unfilled stippled-line curves represent data for isotype-matched control antibody. One typical example from three is given. (C) Human DC were generated by 7 days of incubation with cytokines before being infected as described in the legend to panels A and B. One typical example of two is given.
FIG. 2.
FIG. 2.
cmvIL-10 downregulates the transcription of CD1 molecules. (A and B) Human DC were exposed to cmvIL-10 at 25 ng/ml or left untreated for 3 days before analysis for group 1 CD1 molecules by flow cytometry (A) or qRT-PCR (B). The unfilled solid-line curves represent data for cmvIL-10-treated DC, the gray filled curves represent data for untreated DC, and the unfilled black-, stippled-line curves and unfilled gray-, stippled-line curves represent data for isotype-matched control antibodies corresponding to cmvIL-10-treated DC and untreated DC, respectively. One typical example of three is given. (C) DC were incubated for 3 days in medium supplemented with 10% supernatant from fibroblasts infected with AD169 or RVAdIL10C before analysis by flow cytometry. RVAdIL10C is a mutant of AD169 which lacks cmvIL-10. Data for DC treated with RVAdIL10C supernatant are represented by unfilled black-, solid-line curves, those for DC treated with AD169 supernatant are represented by light gray filled curves, and unfilled black-, stippled-line curves and unfilled gray-, stippled-line curves represent data for isotype-matched control antibodies corresponding to DC treated with RVAdIL10C supernatant and DC treated with AD169 supernatant, respectively. MFIs are shown above the respective curves. One typical example of two is given.
FIG. 3.
FIG. 3.
Antigen presentation by CD1 molecules is blocked by HCMV via a posttranscriptional mechanism. U373 cell lines permanently transfected with group 1 CD1 molecules were infected with HCMV strain NEWT at a MOI of 1 or 5 or mock infected with the same quantity of UV-inactivated virus (uvHCMV). Cells were analyzed by flow cytometry after 3 days (A) or by qRT-PCR analysis of CD1b after 1 and 3 days (B). The unfilled black-, solid-line curves represent data for HCMV-infected cells, the gray filled curves represent data for mock-infected cells, and the unfilled black-, stippled-line curves and unfilled gray-, stippled-line curves represent data for isotype-matched control antibodies corresponding to HCMV-infected cells and mock-infected cells, respectively. One typical example of three is given. n ≥ 3; error bars show standard deviations (SD) of the means.
FIG. 4.
FIG. 4.
HCMV interferes with the stimulation of CD1b-specific T cells. (A) U373-CD1b cells were infected with HCMV strain NEWT at a MOI of 2 or mock infected with the same quantity of UV-inactivated virus (uvHCMV) and used at 3 days postinfection to stimulate a CD1b-specific T-cell line. The levels of antigen-specific activation of T cells were measured by evaluating [3H]thymidine uptake during proliferation and are shown as counts per minute, with error bars showing SD of the means. (B) Autologous DC were infected with HCMV strain NEWT at a MOI of 3 for 3 days before the addition of CD1b-reactive autologous CD4+ T cells or nonspecific T cells. IFN-γ release was measured by an enzyme-linked immunosorbent assay 2 days after stimulation. (C) U373-CD1b cells or U373-CD1b cells with the CD1b cytoplasmic domain deleted (U373-CD1b Δt) were infected as described for panel A and then loaded with calcein and mixed with CD1b-specific T cells at a ratio of 1:10. Supernatant was collected after 5 h, and the quantity of calcein released was determined by fluorimetry. Results reflect experiments with cells from two different donors.
FIG. 5.
FIG. 5.
HCMV-induced cell surface downregulation of group 1 CD1 molecules is accompanied by intracellular accumulation. (A) U373 cell lines permanently transfected with group 1 CD1 molecules were infected with strain AD169 or UV-inactivated virus (uvHCMV) at a MOI of 5 for 3 days. Cells were then harvested and either analyzed by flow cytometry for cell surface antigens or fixed, permeabilized, and analyzed for whole-cell antigens. (B) U373 cells were infected with strain AD169 or UV-inactivated virus at a MOI of 5 for 1 day. Cells were then transiently transfected with plasmids containing group 1 CD1 molecules fused to GFP. Two days later, cells were analyzed by flow cytometry for total CD1 expression (GFP) and cell surface CD1 expression (Cy5). n ≥ 3; error bars show SD of the means.
FIG. 6.
FIG. 6.
Time course and titer dependency of HCMV-encoded CD1 blockade. U373-CD1b cells were infected with strain AD169 at a MOI of 2 for 1 to 5 days for a comparison of CD1b levels to those in cells infected with UV-inactivated virus (uvHCMV) (A) or a MOI of 0.5 to 25 for 3 days for a comparison of CD1b levels to those in uninfected cells (B). Cells were subsequently harvested, and cell surface CD1b was analyzed by flow cytometry. For comparison, cells were infected with HSV-1 strain F at a MOI of 0.5 to 25 for 1 day before analysis by flow cytometry. n = 3; error bars show SD of the means.
FIG. 7.
FIG. 7.
HCMV-encoded MHC-I-blocking molecules do not inhibit group 1 CD1 molecule surface expression. U373 cells expressing group 1 CD1 molecules were transfected with plasmids expressing viral MHC-I-blocking molecules under the control of the cytomegalovirus immediate-early promoter in tandem with GFP under the control of an internal ribosome entry site sequence. Thirty-six hours posttransfection, cells were analyzed by flow cytometry. The CD1 or MHC-I on GFP+ cells was compared to that on GFP cells, and the resulting ratio was compared to that given by control (empty) vector transfection. The decrease in this ratio denotes the efficiency of the blockage. n = 3; error bars show SD of the means.
FIG. 8.
FIG. 8.
The HCMV-induced group 1 CD1 block is caused by an early viral protein. U373 cells expressing group 1 CD1 molecules were infected with strain AD169 or UV-inactivated virus (uvHCMV) at a MOI of 5 for 3 days. Cells were treated with 150 μg of phosphonoacetic acid (PAA)/ml or cycloheximide (CHX)-actinomycin D before being analyzed by flow cytometry (A) and immunocytometry staining (B) for the expression of the HCMV immediate-early IE1 gene and the late gB gene. n = 3; error bars show SD of the means.
FIG. 9.
FIG. 9.
The HCMV-induced group 1 CD1 block is dependent on the cytoplasmic domain of the CD1 molecule. U373 cells expressing a mutant CD1b which lacks the last eight amino acids (CD1bΔt) were infected with strain AD169 or UV-inactivated virus (uvHCMV) at a MOI of 5 for 3 days. Cells were treated with 150 μg of phosphonoacetic acid (PAA)/ml or mock treated before being analyzed by flow cytometry. n = 3; error bars show SD of the means.
FIG. 10.
FIG. 10.
Confocal microscopy analyses of group 1 CD1 distribution and HCMV proteins postinfection. (A) U373 cells expressing CD1b were infected with AD169 or UV-inactivated virus (uvHCMV) at a MOI of 2 for 5 days before being fixed and permeabilized. Cells were stained for viral proteins (red) by using a polyclonal rabbit antiserum generated using preparations of HCMV virions and for CD1b (green). Normal rabbit serum and isotype-matched control antibodies were used to demonstrate specificity. (B) DC infected with HCMV strain NEWT at a MOI of 3 for 3 days were stained for HCMV IE1 (red) and CD1b (green). (C) U373-CD1b cells infected as described in the legend to panel A were stained for CD1b (green), CD63 (red), and HCMV proteins (blue). (D) U373 cells were infected with AD169 or UV-inactivated virus at a MOI of 2 and incubated for 24 h before being cotransfected with plasmids expressing CD1a and CD1b. After a further 4 days, cells were stained for CD1a (red) and CD1b (green). Scale bars show 25 μm.
FIG. 11.
FIG. 11.
The recirculation of CD1 molecules is altered post-HCMV infection. (A) DC were infected with HCMV (strain NEWT) or UV-inactivated HCMV (uvHCMV) at a MOI of 3 for 3 days. For comparison, DC were treated with lipoteichoic acid (LTA), a TLR-2 agonist. Thereafter, cells were stained with CD1c or isotype-matched control antibody, washed, and incubated for 4 h at 4 or 37°C in normal medium. Secondary antibody was then added, and the cells were analyzed by flow cytometry. The change in the staining intensity as a percentage of the staining intensity at 4°C was taken as the degree of endocytosis. (B) U373-CD1c cells infected with AD169 or UV-inactivated AD169 at a MOI of 2 for 5 days were stained with primary antibody or isotype-matched control antibody, washed, and incubated for 4 h at 4 or 37°C in normal medium. Secondary antibody was then added, and the degree of endocytosis was calculated as described for panel A. (C) Alternatively, the U373-CD1c cells were stained with primary antibody or isotype-matched control antibody for 3 h at 37°C. Cell surface antibody was removed by a 2-min wash in an acid buffer, and the cells were then incubated for 3 h at either 4 or 37°C in normal medium. Secondary antibody was then added, and the increase in the staining intensity (MFI) compared to the staining intensity at 4°C was taken as the level of recirculation to the cell surface within this time period. n = 3; error bars show SD of the means.

References

    1. Alcami, A., and U. H. Koszinowski. 2000. Viral mechanisms of immune evasion. Trends Microbiol. 8410-418. - PMC - PubMed
    1. Ashkar, A. A., and K. L. Rosenthal. 2003. Interleukin-15 and natural killer and NKT cells play a critical role in innate protection against genital herpes simplex virus type 2 infection. J. Virol. 7710168-10171. - PMC - PubMed
    1. Borowski, C., and A. Bendelac. 2005. Signaling for NKT cell development: the SAP-FynT connection. J. Exp. Med. 201833-836. - PMC - PubMed
    1. Brigl, M., and M. B. Brenner. 2004. CD1: antigen presentation and T cell function. Annu. Rev. Immunol. 22817-890. - PubMed
    1. Cao, X., M. Sugita, N. van der Wel, J. Lai, R. A. Rogers, P. J. Peters, and M. B. Brenner. 2002. CD1 molecules efficiently present antigen in immature dendritic cells and traffic independently of MHC class II during dendritic cell maturation. J. Immunol. 1694770-4777. - PubMed

Publication types