Comparative Study
. 2008 Feb 20;28(8):1816-23.
doi: 10.1523/JNEUROSCI.1853-07.2008.

Prestimulus oscillatory activity in the alpha band predicts visual discrimination ability

Affiliations
Comparative Study

Prestimulus oscillatory activity in the alpha band predicts visual discrimination ability

Hanneke van Dijk et al. J Neurosci. .

Abstract

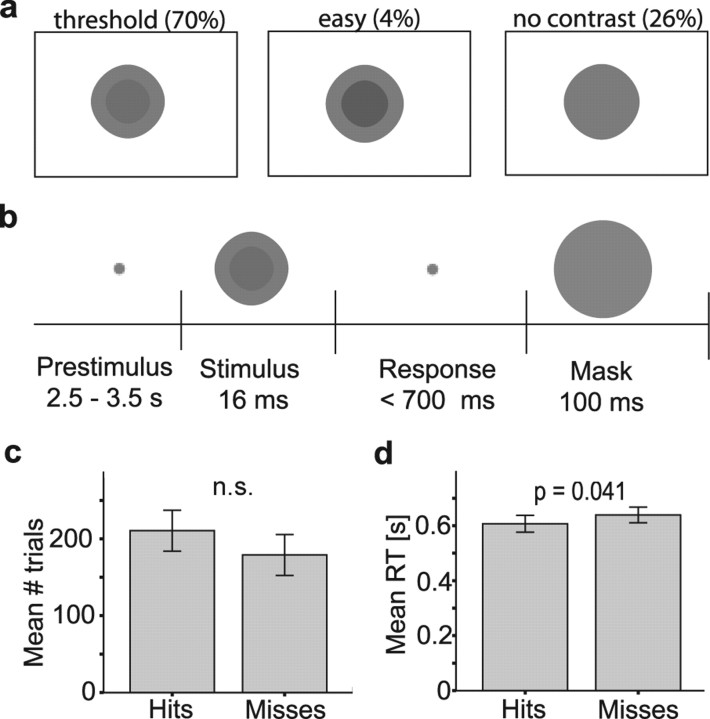
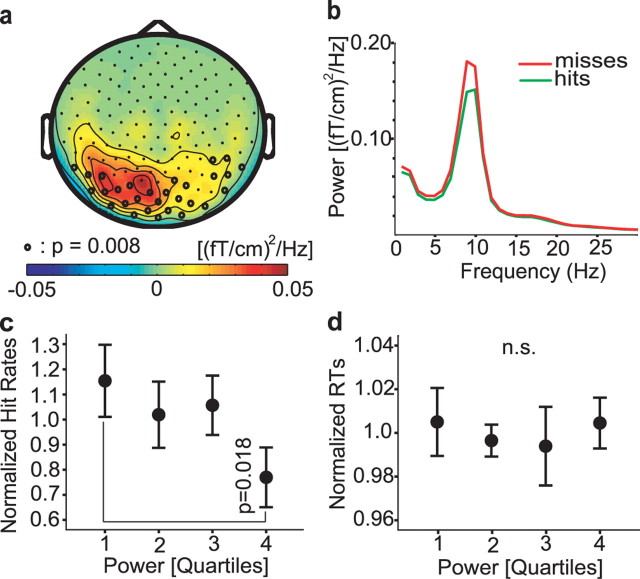
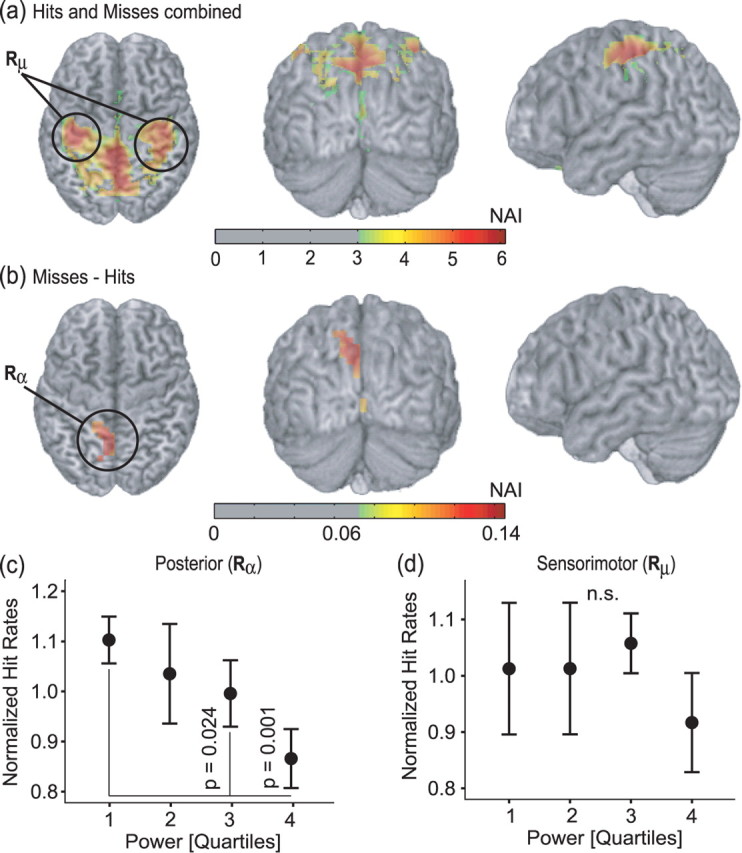
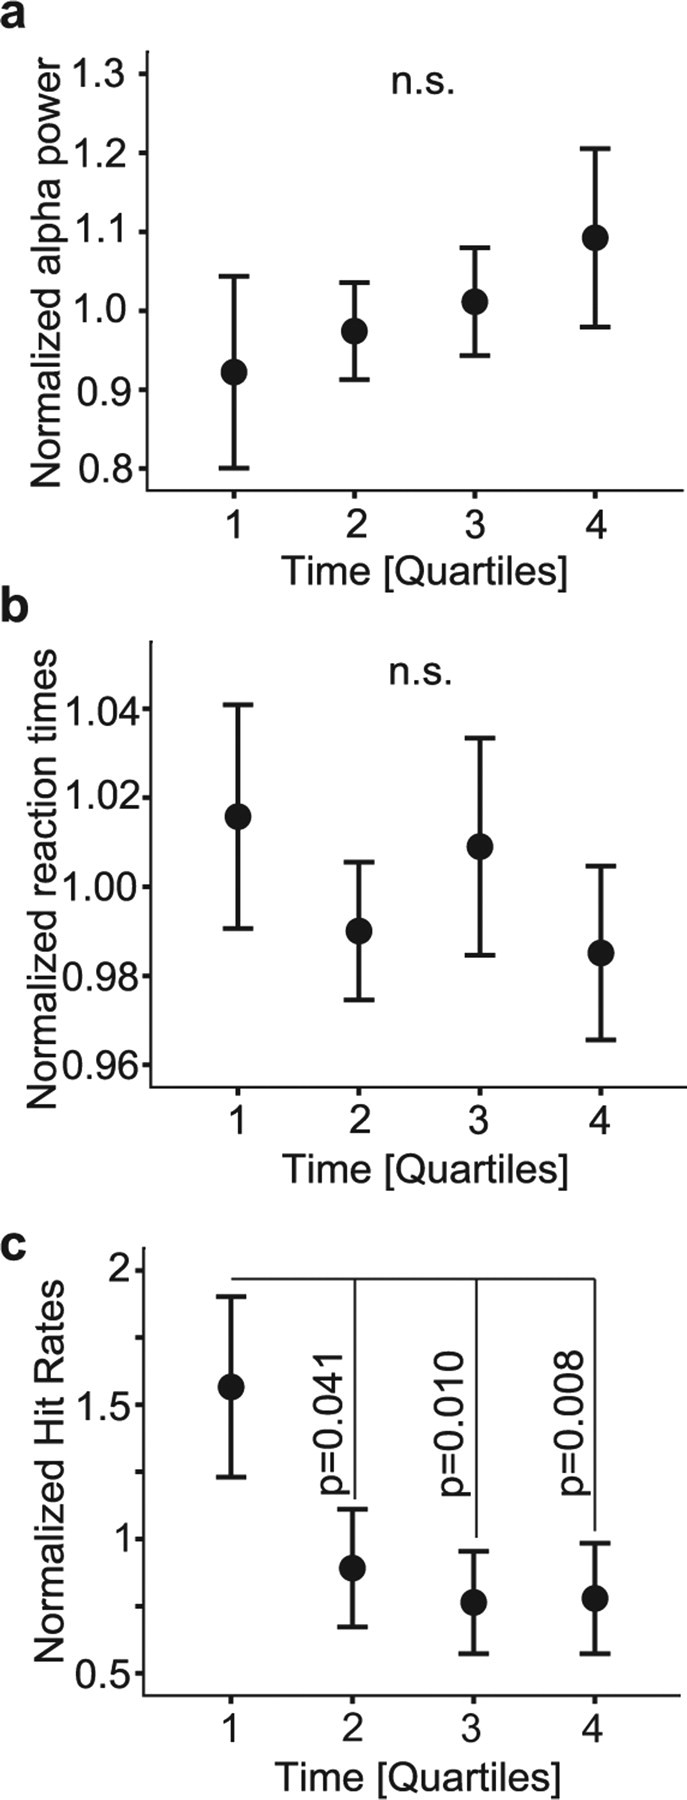
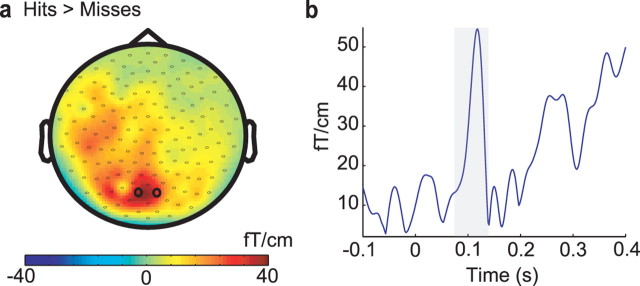
Although the resting and baseline states of the human electroencephalogram and magnetoencephalogram (MEG) are dominated by oscillations in the alpha band (approximately 10 Hz), the functional role of these oscillations remains unclear. In this study we used MEG to investigate how spontaneous oscillations in humans presented before visual stimuli modulate visual perception. Subjects had to report if there was a subtle difference in gray levels between two superimposed presented discs. We then compared the prestimulus brain activity for correctly (hits) versus incorrectly (misses) identified stimuli. We found that visual discrimination ability decreased with an increase in prestimulus alpha power. Given that reaction times did not vary systematically with prestimulus alpha power changes in vigilance are not likely to explain the change in discrimination ability. Source reconstruction using spatial filters allowed us to identify the brain areas accounting for this effect. The dominant sources modulating visual perception were localized around the parieto-occipital sulcus. We suggest that the parieto-occipital alpha power reflects functional inhibition imposed by higher level areas, which serves to modulate the gain of the visual stream.


Figures

Figure 1.
Figure 1.
Task used to determine visual discrimination ability and behavioral data. a, The stimuli consisted of a smaller disc superimposed on a larger disc with different contrasts (gray levels). Contrasts resulting in ∼50% detection defined the threshold stimulus. The contrasts are exaggerated here to make them clearly visible. In 70% of the trials the threshold stimulus was presented. Of the remaining trials, 4% contained an easy contrast stimulus and 26% a no-contrast stimulus. b, After a fixation period with a random duration (2.0–3.5 s) the stimulus was presented for 16 milliseconds. In a forced-choice task, subjects reported whether they detected a contrast difference within a 700 ms response interval. Immediately after the response, a mask was presented. c, There was no significant difference between the number of trials with hits and misses. d, The reaction time for hits was faster than for misses (p = 0.041).
Figure 2.
Figure 2.
Characterization of visual discrimination ability in relation to the prestimulus MEG data. a, Topography of the 8–12 Hz power of the difference between misses and hits (planar gradient) averaged over subjects. Sensors showing significantly stronger alpha power for misses than hits are highlighted with dots (p = 0.008; corrected for multiple comparisons). b, Grand average of the spectra calculated for the prestimulus time window (−1–0 s; green line, hits; red line, misses). The spectra are averaged over the sensors that showed a significant difference between misses and hits in the 8–12 Hz band. c, The trials of the detection session were sorted according to prestimulus alpha power and binned into quartiles. The hit rates (hits divided by misses) were normalized and then averaged over subjects. The hit rates in the first quartile (low alpha power) were significantly higher than those in the fourth quartile (p = 0.018). d, The reaction times for each quartile normalized and averaged over subjects. The reaction times did not show a statistically significant correlation with alpha power. Error bars represent SEM.
Figure 3.
Figure 3.
Source estimation of the prestimulus alpha activity and characterization of the data using virtual sensors. a, The source estimates of the prestimulus 8–12 Hz activity for hits and misses were combined for each subject, normalized to a standard brain and then averaged. The sensorimotor mu sources are indicated (Rμ). b, The estimated source activity for hits subtracted from the misses. The posterior alpha source is indicated (Rα). Sources maps were thresholded with respect to 50% of the maximum. The colors represent NAIs. c, Hit rates for the posterior alpha source (Rα). The hit rates for the third and fourth quartile differ from the first quartile (p = 0.024 and p = 0.001, respectively). d, Hit rates were not correlated with by the 8–12 Hz activity from for the bilateral mu sources (Rμ). Error bars represent SEM.
Figure 4.
Figure 4.
Characterization of the 8–12 Hz alpha activity with respect to the eyes open/closed task. a, Topography of the 8–12 Hz power for eyes open subtracted from eyes closed. Sensors that differ significantly are marked with dots (p < 0.001 corrected for multiple comparisons, cluster analysis). b, The spectra for the sensors that showed the biggest difference (sensors over occipital areas; MLO11). c, Sources accounting for the eyes open/closed difference in the alpha band. The source estimates for the 8–12 Hz activity for eyes closed and open were subtracted for each subject, normalized to a standard brain and then averaged. The source maps were masked with respect to 50% of the maximum. The colors represent NAIs.
Figure 5.
Figure 5.
Alpha power and reaction times during the experiment. a, b, The alpha power (a) and reaction times (b) did not change during the course of the experiment. c, Hit rates were significantly stronger in the first quartile compared with the rest. Error bars represent SEM.
Figure 6.
Figure 6.
Difference in ERFs with respect to hits and misses. a, Topography of the difference between hits and misses (combined planar gradient), 90–135 ms, averaged over subjects. b, The time window is depicted by a gray bar. The time course of the ERF difference between hits and misses averaged over subjects and averaged over the sensors depicted in a by open circles.

References

    1. Ahonen AI, Hamalainen MS, Ilmoniemi RJ, Kajola MJ, Knuutila JE, Simola JT, Vilkman VA. Sampling theory for neuromagnetic detector arrays. IEEE Trans Biomed Eng. 1993;40:859–869. - PubMed
    1. Babiloni C, Brancucci A, Babiloni F, Capotosto P, Carducci F, Cincotti F, Arendt-Nielsen L, Chen AC, Rossini PM. Anticipatory cortical responses during the expectancy of a predictable painful stimulation. A high-resolution electroencephalography study. Eur J Neurosci. 2003;18:1692–1700. - PubMed
    1. Babiloni C, Vecchio F, Bultrini A, Luca Romani G, Rossini PM. Pre- and poststimulus alpha rhythms are related to conscious visual perception: a high-resolution EEG study. Cereb Cortex. 2006;16:1690–1700. - PubMed
    1. Bastiaansen MC, Knosche TR. Tangential derivative mapping of axial MEG applied to event-related desynchronization research. Clin Neurophysiol. 2000;111:1300–1305. - PubMed
    1. Berger H. Über das elektroenkephalogramm des menschen. Arch Psychiatr Nervenkr. 1929;87:527–570.

Publication types

LinkOut - more resources