. 2008 May;19(5):2328-38.
doi: 10.1091/mbc.e07-10-1086. Epub 2008 Feb 20.

mDia2 induces the actin scaffold for the contractile ring and stabilizes its position during cytokinesis in NIH 3T3 cells

Affiliations

mDia2 induces the actin scaffold for the contractile ring and stabilizes its position during cytokinesis in NIH 3T3 cells

Sadanori Watanabe et al. Mol Biol Cell. 2008 May.

Abstract

mDia proteins are mammalian homologues of Drosophila diaphanous and belong to the formin family proteins that catalyze actin nucleation and polymerization. Although formin family proteins of nonmammalian species such as Drosophila diaphanous are essential in cytokinesis, whether and how mDia proteins function in cytokinesis remain unknown. Here we depleted each of the three mDia isoforms in NIH 3T3 cells by RNA interference and examined this issue. Depletion of mDia2 selectively increased the number of binucleate cells, which was corrected by coexpression of RNAi-resistant full-length mDia2. mDia2 accumulates in the cleavage furrow during anaphase to telophase, and concentrates in the midbody at the end of cytokinesis. Depletion of mDia2 induced contraction at aberrant sites of dividing cells, where contractile ring components such as RhoA, myosin, anillin, and phosphorylated ERM accumulated. Treatment with blebbistatin suppressed abnormal contraction, corrected localization of the above components, and revealed that the amount of F-actin at the equatorial region during anaphase/telophase was significantly decreased with mDia2 RNAi. These results demonstrate that mDia2 is essential in mammalian cell cytokinesis and that mDia2-induced F-actin forms a scaffold for the contractile ring and maintains its position in the middle of a dividing cell.


Figures
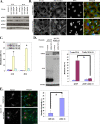
Figure 1.
Figure 1.
Effects of depletion of mDia isoforms in NIH 3T3 cells. (A) Depletion of mDia proteins (mDia1, mDia2 and mDia3) by siRNA treatment. NIH 3T3 cells were treated with siRNA specific for mDia1, 2, and 3 (A6, siRNAmDia2#1 and siRNAmDia3#2, respectively) or scrambled control siRNA. After 24 and 48 h, the cells were harvested and subjected to immunoblot for each protein. (B) Fluorescence staining for DNA (blue), F-actin (red), and tubulin (green) in NIH 3T3 cells treated with siRNAmDia2#1 for 48 h. All images show stacks of 10 different focal planes. Bar, 50 μm. Arrows represent examples of the binucleate cells. (C) Frequency of binucleation in NIH 3T3 cells subjected to RNAi for mDia isoforms. NIH 3T3 cells were subjected to RNAi as indicated and the number of binucleate cells in each population was determined. The results are from three independent experiments, in each of which N > 200 cells were examined. Values are shown as percentage of binucleate cells. Error bars, SD. *p < 0.01 versus control RNAi, mDia1 RNAi, and mDia3 RNAi cells. (D) Rescue of the binucleate phenotype by expression of RNAi-resistant full-length mDia2 construct. NIH 3T3 cells were transfected with pEGFP or pEGFP-mDia2 r#1, and after 24 h, the cells were subjected to control or mDia2 RNAi (siRNAmDia2#1) for 48 h. The cells were either subjected to Western blotting with anti-mDia2 (top), GFP (middle), or tubulin (bottom, left) or subjected to fluorescence staining as described above for determining the number of binucleate cells in each population. Values are shown as percentage of binucleate cells expressing GFP per total cells expressing GFP (right). Error bars, SD. *p < 0.01. (E) Effects of microinjection of N1 antibody to mDia2. Control IgG or N1 antibody to mDia2 were microinjected into randomly growing NIH 3T3 cells along with Alexa Fluor 594 Dextran as a marker, and after 10 h the cells were fixed and stained for tubulin (green) and DNA (blue). Left, immunofluorescence images of control IgG- (top) or anti-mDia2 antibody- (bottom) injected NIH 3T3 cells. Bar, 50 μm. Right, values are shown as percentage of binucleate cells per injected cells. Error bars, SD. *p < 0.01. The results are from three independent experiments, in each of which N > 100 cells were examined.
Figure 2.
Figure 2.
Localization of mDia2 during cell division. NIH 3T3 cells in different phases of cell division were stained for mDia2 (red), tubulin (green), and DNA (blue). Each image shows a single focal plane; the image of a prometaphase cell represents that at the basal plane, and those of cells in anaphase, telophase and cytokinesis represent those at the middle plane. Bar, 5 μm.
Figure 3.
Figure 3.
Cytokinesis failure in mDia2-RNAi cells. (A–C) Selected frames from time-lapse movies of NIH 3T3 cells subjected to control RNAi (A and Movie S2) or RNAi for mDia2 (B and C and Movies S3 and S4). Phase contrast and green fluorescence images were monitored by videomicroscopy after DNA (green) was stained by Syto11. 0 min, anaphase onset. Insets show magnified views of the DNA in each merged image. Arrows in B and C indicate abnormal contraction in the mDia2-depleted cells. Bar, 10 μm.
Figure 4.
Figure 4.
Abnormal localization of contractile ring components during anaphase/telophase in mDia2-depleted cells. (A) Immunofluorescence. NIH 3T3 cells were transfected with siRNA for mDia2 (siRNAmDia2#1) and synchronized with thymidine and nocodazole, and at 32 h after transfection the cells were released into DMEM containing 10% FCS for 20 min. The cells were fixed and stained for indicated molecules (red), tubulin (green), and DNA (blue). All images show stacks of focal planes as described in Materials and Methods. Bar, 5 μm. Arrows indicate abnormal accumulation of indicated molecules. (B and C) Selected frames from time-lapse movies of NIH 3T3 cells subjected to control (B and Movies S5 and S6) or mDia2 RNAi (C and Movies S7 and S8), and labeled with DsRed-histone H2Bk (red) and MRLC-EGFP (green). Bar, 5 μm. (D) Effects of combined depletion of mDia2 and other mDia isoforms. NIH 3T3 cells were transfected with siRNA for mDia isoforms in indicated combination for 48 h, and the cells were stained for F-actin (red), tubulin (green), and DNA (blue). A typical example is shown out of 20 cells examined. Arrows indicate abnormal accumulation of F-actin. Bar, 5 μm.
Figure 5.
Figure 5.
Localization of contractile ring components in blebbistatin-treated cells. NIH 3T3 cells were subjected to control or mDia2 RNAi and synchronized with thymidine and nocodazole, and at 32 h after transfection the cells were released into the medium containing 80 μM blebbistatin for 20 min. The cells were fixed and stained for indicated molecules (red), tubulin (green), and DNA (blue). All images show stacks of focal planes as described in Materials and Methods. Bar, 5 μm. (A) Phalloidin staining for F-actin in blebbistatin-treated cells. Left, phalloidin staining of control or mDia2-RNAi cells are shown. Right, quantitative analysis of fluorescence intensity for F-actin in control or mDia2-RNAi cells. Fluorescence intensity of phalloidin staining for total area of each cell was quantified using MetaMorph in 20 cells of each group from two different experiments as described in Materials and Methods. *p < 0.01. (B) Immunofluorescence for MyosinIIA, anillin, and pERM in blebbistatin-treated cells.
Figure 6.
Figure 6.
Effects of mDia2 depletion on RhoA localization during cytokinesis. (A) Aberrant localization of RhoA in mDia2-RNAi cells. NIH 3T3 cells were transfected and synchronized as described in the legend for Figure 4. The cells were released into the medium without blebbistatin. After 20 min, the cells were fixed and stained for RhoA (red), tubulin (green), and DNA (blue). All images show stacks of 15–25 focal planes. Bar, 5 μm. (B) Effects of blebbistatin on RhoA localization in mDia2-RNAi cells. NIH 3T3 cells were subjected to mDia2 RNAi and synchronized with double thymidine block. The cells were treated with DMSO or 80 μM blebbistatin for 30 min 6.5 h after thymidine removal and stained for RhoA (red), tubulin (green), and DNA (blue). All images show stacks of 15–25 focal planes. Bar, 5 μm.

References

    1. Alberts A. S., Bouquin N., Johnston L. H., Treisman R. Analysis of RhoA-binding proteins reveals an interaction domain conserved in heterotrimeric G protein beta subunits and the yeast response regulator protein Skn7. J. Biol. Chem. 1998;273:8616–8622. - PubMed
    1. Ando Y., Yasuda S., Oceguera-Yanez F., Narumiya S. Inactivation of Rho GTPases with Clostridium difficile toxin B impairs centrosomal activation of Aurora-A in G2/M transition of HeLa cells. Mol. Biol. Cell. 2007;18:3752–3763. - PMC - PubMed
    1. Arakawa Y., Bito H., Furuyashiki T., Tsuji T., Takemoto-Kimura S., Kimura K., Nozaki K., Hashimoto N., Narumiya S. Control of axon elongation via an SDF-1α/Rho/mDia pathway in cultured cerebellar granule neurons. J. Cell Biol. 2003;161:381–391. - PMC - PubMed
    1. Balasubramanian M. K., Bi E., Glotzer M. Comparative analysis of cytokinesis in budding yeast, fission yeast and animal cells. Curr. Biol. 2004;14:R806–R818. - PubMed
    1. Canman J. C., Cameron L. A., Maddox P. S., Straight A., Tirnauer J. S., Mitchison T. J., Fang G., Kapoor T. M., Salmon E. D. Determining the position of the cell division plane. Nature. 2003;424:1074–1078. - PubMed

Publication types

MeSH terms

LinkOut - more resources