. 2008 May;19(5):1912-21.
doi: 10.1091/mbc.e07-09-0973. Epub 2008 Feb 20.

Tight junction proteins claudin-2 and -12 are critical for vitamin D-dependent Ca2+ absorption between enterocytes

Affiliations

Tight junction proteins claudin-2 and -12 are critical for vitamin D-dependent Ca2+ absorption between enterocytes

Hiroki Fujita et al. Mol Biol Cell. 2008 May.

Abstract

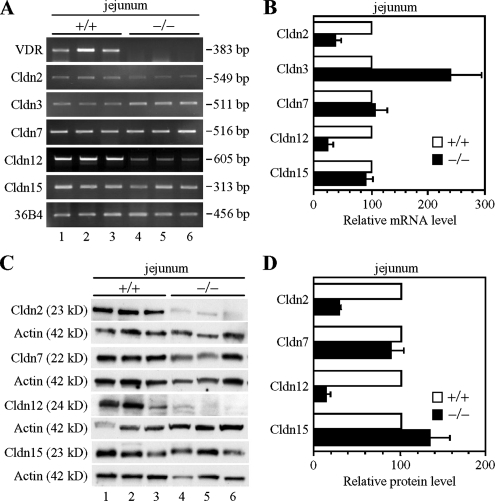
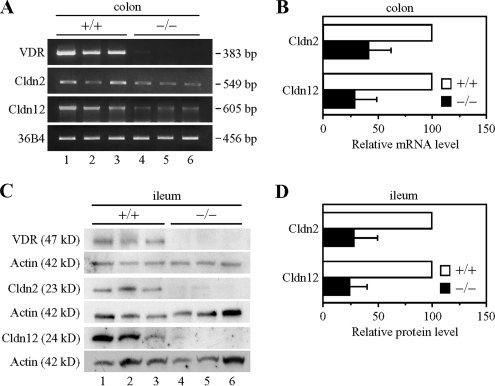
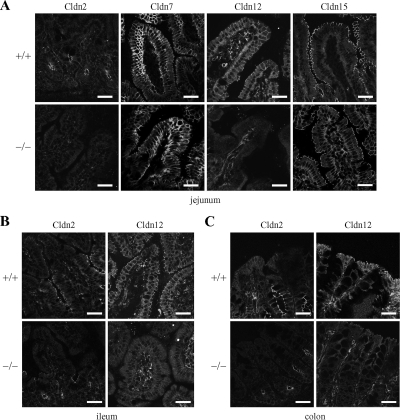
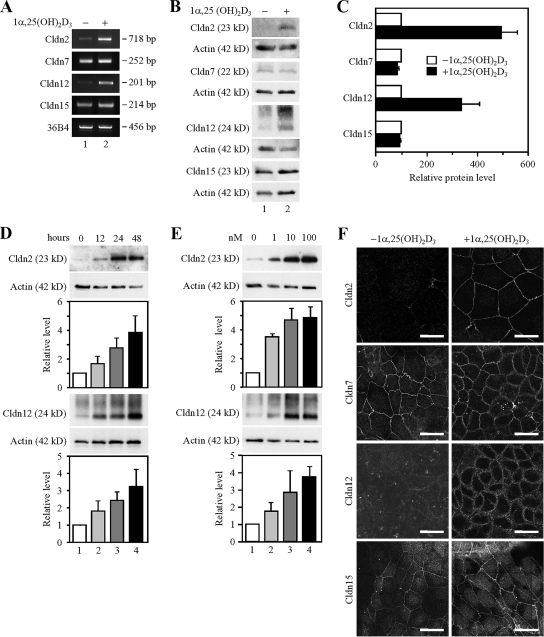
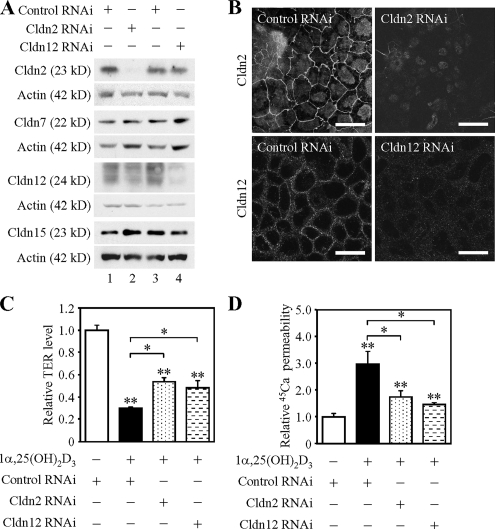
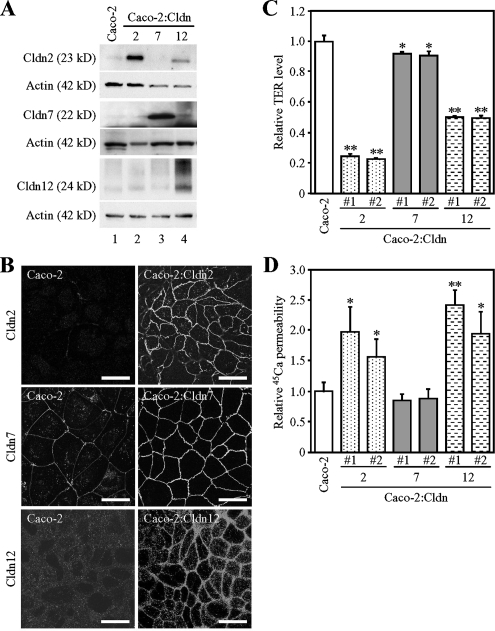
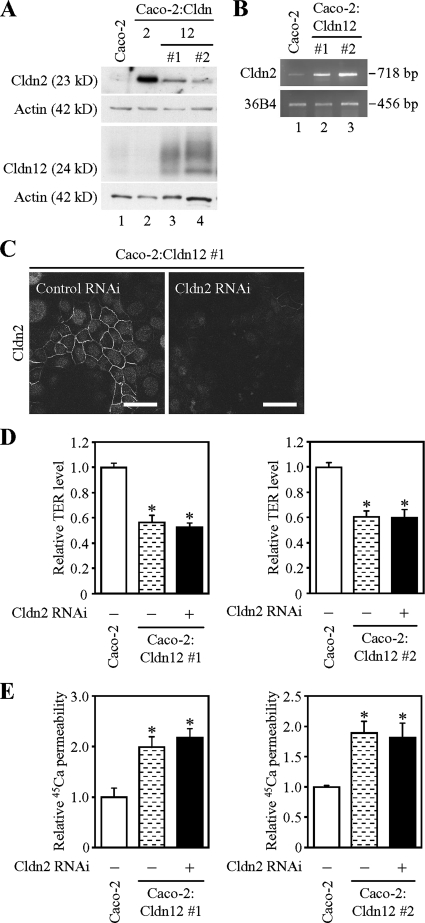
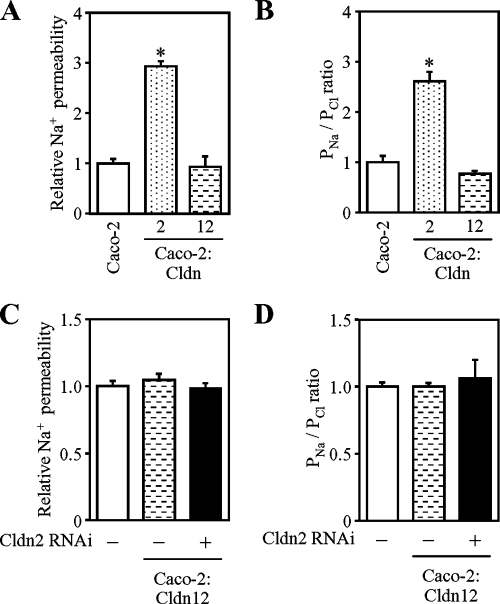
Ca(2+) is absorbed across intestinal epithelial monolayers via transcellular and paracellular pathways, and an active form of vitamin D(3), 1alpha,25-dihydroxyvitamin D(3) [1alpha,25(OH)(2)D(3)], is known to promote intestinal Ca(2+) absorption. However, the molecules driving the paracellular Ca(2+) absorption and its vitamin D dependency remain obscure. Because the tight junction proteins claudins are suggested to form paracellular channels for selective ions between neighboring cells, we hypothesized that specific intestinal claudins might facilitate paracellular Ca(2+) transport and that expression of these claudins could be induced by 1alpha,25(OH)(2)D(3). Herein, we show, by using RNA interference and overexpression strategies, that claudin-2 and claudin-12 contribute to Ca(2+) absorption in intestinal epithelial cells. We also provide evidence showing that expression of claudins-2 and -12 is up-regulated in enterocytes in vitro and in vivo by 1alpha,25(OH)(2)D(3) through the vitamin D receptor. These findings strongly suggest that claudin-2- and/or claudin-12-based tight junctions form paracellular Ca(2+) channels in intestinal epithelia, and they highlight a novel mechanism behind vitamin D-dependent calcium homeostasis.


Figures

Figure 1.
Figure 1.
Reduced expression of claudins-2 and -12 in the jejunum of VDRKO mice. (A) Gene expression of Cldns in the jejunum of wild-type (+/+; lanes 1–3) and VDRKO mice (−/−; lanes 4–6) at 12 wk of age. One microgram of total RNA from the jejunum was subjected to RT-PCR analysis for the indicated genes. PCR was performed for 20 (36B4), 21 (Cldn3 and Cldn7), 25 (Cldn15), 28 (Cldn2), 32 (Cldn12), or 36 (VDR) cycles. (B) RT-PCR analysis was performed as described in A for at least five independent experiments. The mRNA levels were normalized to the corresponding 36B4 levels and expressed relative to the amount present in the wild-type mice, which was taken as 100. Values represent the mean ± SD (error bars; n = 5 for Cldn7 and n = 6 for other Cldns). (C) Expression of Cldn proteins in the jejunum of each genotype at 12 wk of age. Twenty-five micrograms of whole cell extract from the jejunum was separated by SDS-PAGE and immunoblotted with the corresponding antibodies followed by chemiluminescence detection. Each blot was stripped and reimmunoprobed with an anti-actin antibody. (D) Western blot analysis was performed as in C for at least four independent experiments. The protein levels are normalized to the corresponding actin levels and expressed relative to the amount present in wild-type mice, which was taken as 100. Values represent the mean ± SD (error bars; n = 4 for Cldn15, n = 6 for Cldn2 and Cldn7, and n = 7 for Cldn12).
Figure 2.
Figure 2.
Down-regulation of claudins-2 and -12 in the ileum and colon of VDRKO mice. (A) Gene expression of claudin-2 (Cldn2) and Cldn12 in the colon of wild-type (+/+; lanes 1–3) and VDRKO mice (−/−; lanes 4–6) at 12 wk of age. One microgram of total RNA from the jejunum was subjected to RT-PCR analysis for the indicated genes. PCR was performed for 20 (36B4), 23 (Cldn2), or 36 (Cldn12 and VDR) cycles. (B) RT-PCR analysis was performed as described in A for at least four independent experiments. The mRNA levels are normalized to the corresponding 36B4 levels and expressed relative to the amount present in the wild-type mice, which was taken as 100. Values represent the mean ± SD (error bars; n = 4 for Cldn12 and n = 6 for Cldn2). (C) Expression of Cldn2 and Cldn12 proteins in the ileum of each genotype at 12 wk of age. Twenty-five micrograms of whole cell extract from the ileum was separated by SDS-PAGE and immunoblotted with the corresponding antibodies followed by chemiluminescence detection. Each blot was stripped and reimmunoprobed with an anti-actin antibody. (D) Western blot analysis was performed as described in C for at least five independent experiments. The protein levels are normalized to the corresponding actin levels and expressed relative to the amount present in wild-type mice, which was taken as 100. Values represent the mean ± SD (error bars; n = 5 for Cldn2 and n = 8 for Cldn12).
Figure 3.
Figure 3.
Distribution of claudins in intestinal mucosa of wild-type (+/+) and VDRKO (−/−) mice. Sections of the jejunum (A), ileum (B), and colon (C) of mice at 12 wk of age were subjected to immunostaining with the corresponding antibodies. Bar, 30 μm.
Figure 4.
Figure 4.
Induction of the expression of claudins-2 and -12 by 1α,25(OH)2D3 in Caco-2 cells. (A) Expression of Cldn mRNAs in Caco-2 cells treated for 48 h with the vehicle (lane 1) or 100 nM 1α,25(OH)2D3 (lane 2). One microgram of total RNA from the cells was subjected to RT-PCR analysis for indicated genes. PCR was performed for 22 (36B4), 30 (Cldn12 and Cldn15) or 32 (Cldn2 and Cldn7) cycles. (B) Expression of Cldn proteins in Caco-2 cells grown for 48 h in the absence (lane 1) or presence of 100 nM 1α,25(OH)2D3 (lane 2). Twenty-five micrograms of whole cell extract was separated by SDS-PAGE and immunoblotted with antibodies against the corresponding claudins, followed by chemiluminescence detection. The blots were stripped and immunoprobed with an anti-actin antibody. (C) Western blot analysis was performed as in C for three independent experiments. The protein levels are normalized to the corresponding actin levels and expressed relative to the amount present in the cells cultured without 1α,25(OH)2D3, which was taken as 100. Values represent the mean ± SD (error bars; n = 3). (D) Expression of Cldn2 and Cldn12 proteins in Caco-2 cells exposed to 100 nM 1α,25(OH)2D3 for 0, 12, 24, and 48 h (lanes 1–4, respectively). Western blot analysis was performed as described in B for three independent experiments, and the protein levels are expressed as described in C (error bars; n = 3). (E) Expression of Cldn2 and Cldn12 proteins in Caco-2 cells treated for 48 h with 0, 1, 10, and 100 nM 1α,25(OH)2D3 (lanes 1–4, respectively). Western blot analysis was performed as described in B for three independent experiments, and the protein levels are expressed as described in C (error bars; n = 3). (E) Staining pattern of Cldn2, Cldn7, Cldn12, and Cldn15 in Caco-2 cells grown for 48 h in the absence or presence of 100 nM 1α,25(OH)2D3. Cells were subjected to immunostaining with the corresponding antibodies, and they were observed under a laser-scanning confocal microscope. Bars, 20 μm.
Figure 5.
Figure 5.
Knockdown of claudins-2 and -12 impairs vitamin D-induced calcium transport across Caco-2 cells. (A) Suppression of claudin-2 (Cldn2) and Cldn12 expression in Caco-2 cells by RNAi. Cells were transfected with negative control siRNA (lanes 1 and 3) or siRNAs against Cldn2 (#1) (lane 2) and Cldn12 (#1) (lane 4), incubated for 12 h after transfection, and then treated for 48 h with 100 nM 1α,25(OH)2D3. Twenty-five micrograms of whole cell extract from the cells was separated by SDS-PAGE and immunoblotted with the corresponding antibodies, followed by chemiluminescence detection. The blots were stripped and immunoprobed with an anti-actin antibody. (B) Disappearance of Cldn2 and Cldn12 along cell borders in Caco-2 cells by RNAi. Cells were transfected and treated as described in A, subjected to immunostaining with the corresponding antibodies, and observed under a laser-scanning confocal microscope. Bars, 20 μm. (C and D) Suppression of Cldn2 and Cldn12 expression in Caco-2 cells prevents 1α,25(OH)2D3-dependent decrease in TER levels and increase in 45Ca2+ transport. Cells were transfected and treated as described in A, subjected to measurement of TER (C) and calcium transport studies (D). The values of TER and 45Ca2+ permeability are expressed relative to the level in cells transfected with negative control siRNA and grown without 1α,25(OH)2D3, which was taken as 1, and they represent the mean ± SD (error bars; n = 4). *p < 0.05 and **p < 0.01 compared with values of cells grown without 1α,25(OH)2D3.
Figure 6.
Figure 6.
Overexpression of claudins-2 and -12 promotes calcium transport in Caco-2 cells. (A) Expression of claudin-2 (Cldn2), Cldn7, and Cldn12 proteins in Caco-2 and Caco-2:Cldn transfectants. Twenty-five micrograms of whole cell extract from the cells was separated by SDS-PAGE and immunoblotted with antibodies against the corresponding claudins, followed by chemiluminescence detection. The blots were stripped and reimmunoprobed with an anti-actin antibody. (B) Staining pattern of Cldn2, Cldn7, and Cldn12 in Caco-2 and Caco-2:Cldn transfectants. Cells were subjected to immunostaining with the corresponding claudin antibodies. Bar, 20 μm. (C and D) Relative levels of TER (C) and 45Ca2+ transport (D) in Caco-2 and Caco-2:Cldn transfectants. The values of TER and 45Ca2+ permeability in Caco-2:Cldn transfectants (clones #1 and #2) are expressed relative to the level in the mock-transfected cells, which was taken as 1, and they represent the mean ± SD (error bars; n = 4). *p < 0.05 and **p < 0.01 compared with values of the mock-transfected cells.
Figure 7.
Figure 7.
Weak induction of claudin-2 does not contribute to increased calcium transport in Caco-2 cells overexpressing claudin-12. (A and B) Slight induction of endogenous Cldn2 protein (A) and mRNA (B) in Caco-2:Cldn12 cells (clones #1 and #2). (A) Twenty-five micrograms of whole cell extract from the cells was separated by SDS-PAGE and immunoblotted with antibodies against the corresponding claudins, followed by chemiluminescence detection. The blots were stripped and reimmunoprobed with anti-actin antibody. (B) One microgram of total RNA from the cells was subjected to RT-PCR analysis for indicated genes. PCR was performed for 23 (36B4) or 30 (Cldn2) cycles. (C) Knockdown of endogenous Cldn2 expression in Caco-2:Cldn12 cells (clone #1) by RNAi. Cells were transfected with negative control siRNA (left) or siRNA against Cldn2 (#1; right), incubated for 12 h after transfection, and then they were refed and grown for 48 h. They were subjected to immunostaining with the corresponding antibodies, and they were observed under a laser-scanning confocal microscope. Bars, 20 μm. (D and E) Effects of suppressed endogenous Cldn2 on TER (D) and 45Ca2+ permeability in Caco-2:Cldn12 cells (clones #1 and #2). Cells were transfected and grown as described in C, and then they were subjected to measurement of TER (D) and calcium transport studies (E). The values are expressed relative to the level in Caco-2 cells transfected with negative control siRNA, which was taken as 1, and they represent the mean ± SD (error bars; n = 6 [left] and n = 3 [right]). *p < 0.01 compared with values of the mock-transfected cells.
Figure 8.
Figure 8.
Overexpression of claudin-2, but not claudin-12, increases Na+ permeability in Caco-2. (A and B) Na+ permeability (A) and relative levels of Na+/Cl permeability (B; PNa/PCl) in Caco-2, Caco-2:Cldn2 (clone #2) and Caco-2:Cldn12 (clone #1). (C and D) Effects of suppressed endogenous Cldn2 on Na+ permeability (C) and Na+/Cl (D) in Caco-2:Cldn12 cells (clones #1). Cells were transfected with negative control siRNA (left) or siRNA against Cldn2 (#1, right), incubated for 12 h after transfection, and then they were refed and grown for 48 h. They were then subjected to the measurement. The values are expressed relative to the level in Caco-2 cells transfected with negative control siRNA, which was taken as 1, and they represent the mean ± SD (error bars; n = 4). *p < 0.01 compared with values of the mock-transfected cells.

References

    1. Anderson J. M., Cereijido M. Introduction: evolution of ideas on the tight junction. In: Cereijido M., Anderson J. M., editors. Tight junctions. Boca Raton, FL: CRC Press; 2001. pp. 1–18.
    1. Alexandre M. D., Lu Q., Chen Y. H. Overexpression of claudin-7 decreases the paracellular Cl− conductance and increases the paracellular Na+ conductance in LLC-PK1 cells. J. Cell Sci. 2005;118:2683–2693. - PubMed
    1. Amasheh S., Meiri N., Gitter A. H., Schöneberg T., Mankertz J., Schulzke J. D., Fromm M. Claudin-2 expression induces cation-selective channels in tight junctions of epithelial cells. J. Cell Sci. 2002;115:4969–4976. - PubMed
    1. Battle M. A., Konopka G., Parviz F., Gaggl A. L., Yang C., Sladek F. M., Duncan S. A. Hepatocyte nuclear factor 4α orchestrates expression of cell adhesion proteins during the epithelial transformation of the developing liver. Proc. Natl. Acad. Sci. USA. 2006;103:8419–8424. - PMC - PubMed
    1. Bronner F., Pansu D., Stein W. D. An analysis of intestinal calcium transport across the rat intestine. Am. J. Physiol. Gastrointestinal. Liver Physiol. 1986;250:G561–G569. - PubMed

Publication types

MeSH terms