. 2008 May;19(5):2026-38.
doi: 10.1091/mbc.e07-08-0802. Epub 2008 Feb 20.

Paralemmin-1, a modulator of filopodia induction is required for spine maturation

Affiliations

Paralemmin-1, a modulator of filopodia induction is required for spine maturation

Pamela Arstikaitis et al. Mol Biol Cell. 2008 May.

Abstract

Dendritic filopodia are thought to participate in neuronal contact formation and development of dendritic spines; however, molecules that regulate filopodia extension and their maturation to spines remain largely unknown. Here we identify paralemmin-1 as a regulator of filopodia induction and spine maturation. Paralemmin-1 localizes to dendritic membranes, and its ability to induce filopodia and recruit synaptic elements to contact sites requires protein acylation. Effects of paralemmin-1 on synapse maturation are modulated by alternative splicing that regulates spine formation and recruitment of AMPA-type glutamate receptors. Paralemmin-1 enrichment at the plasma membrane is subject to rapid changes in neuronal excitability, and this process controls neuronal activity-driven effects on protrusion expansion. Knockdown of paralemmin-1 in developing neurons reduces the number of filopodia and spines formed and diminishes the effects of Shank1b on the transformation of existing filopodia into spines. Our study identifies a key role for paralemmin-1 in spine maturation through modulation of filopodia induction.


Figures
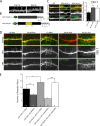
Figure 1.
Figure 1.
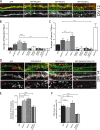
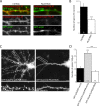
Paralemmin-1 is required for filopodia induction in developing neurons. (A) Paralemmin-1 is localized to the plasma membrane, filopodia, and spines in primary hippocampal neurons. Immunocytochemical staining of cultured hippocampal neurons reveals that paralemmin-1 is localized in patches along the plasma membrane. It is also detected in dendritic filopodia at 10 days in vitro (DIV 10) and spines in mature neurons (DIV26). (B) Diagram showing structure of wild-type GFP-tagged paralemmin-1 splice variants. Location of the palmitoylated cysteines (C334, C336) and the prenylated residue (C337) is indicated. (C) Both paralemmin-1 splice variants induce filopodia at DIV 7. Hippocampal neurons were cotransfected at DIV 5 with RFP and either GFP, GFP-paralemmin-S, the short variant of paralemmin-1 lacking sequences encoded by exon 8 (GFP-PALM-S) or GFP-paralemmin-L, the long variant containing sequences encoded by exon 8 (GFP-PALM-L). Quantification of the number of filopodia/100 μm shows that expression of both paralemmin-1 splice variants increase filopodia number. Number of cells analyzed for each group is indicated at the bottom of each bar. Number of filopodia analyzed per group: GFP+RFP = 270, GFP-PALM-S+RFP = 402, and GFP-PALM-L+RFP = 387. *p < 0.05, **p < 0.01. Data represent mean ± SEM. (D) Knockdown of paralemmin-1 influences the number of filopodia formed at DIV 7. Neurons were cotransfected with RFP and either with GFP or GFP-PALM-L, and scramble RNAi as a control (Ctl RNAi) or with paralemmin-1 specific RNAi (PALM RNAi). Paralemmin-1–resistant RNAi (PALM Res.) was also used to determine whether changes in filopodia number are due to specific knockdown of paralemmin-1. (E) Quantification of the number of filopodia/100 μm shows paralemmin-1 knockdown diminishes the number of filopodia formed, and these effects can be rescued upon expression PALM Res. Number of cells analyzed for each group is indicated at the bottom of each bar. Number of filopodia analyzed per group: GFP+RFP+Ctl RNAi = 666, GFP+RFP+PALM RNAi = 532, RFP+PALM-L+Ctl RNAi = 507, PALM-L+RFP+PALM RNAi = 202, and RFP+PALM-L Res+ PALM RNAi = 531. *p < 0.05, **p < 0.01, ***p < 0.001. Data represent mean ± SEM. Scale bars, 10 μm.
Figure 2.
Figure 2.
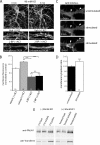
Long-term expression of paralemmin-1 induces spine maturation. (A and D) Effects of paralemmin-1 expression on the number of filopodia and spines formed was assessed in hippocampal neurons cotransfected with RFP (red) and either GFP (green), GFP-tagged paralemmin CT [GFP-PALM (CT)], GFP-tagged paralemmin-S (GFP-PALM-S), GFP-tagged paralemmin-L (GFP-PALM-L), mutant forms of GFP-PALM-S either lacking Cys 334 [GFP-PALM-S (C334S), Cys336 (GFP-PALM-S (C336S), or Cys334, Cys336, Cys337 (GFP-PALM-S (C334,6,7S)[, and GFP-PALM-L (C336S), at DIV 7 and fixed at DIV 12–14. Expression of various paralemmin-1 recombinant forms on dendritic protrusions was contrasted to GFP-tagged Shank1b (GFP-Shank1b). (B and C) Results show that GFP-PALM (CT), GFP-PALM-S, and GFP-PALM-L, but not the palmitoylation-deficient forms, increases the number of filopodia and spines formed. More robust effects on spine maturation were observed with GFP-PALM-L. In contrast, GFP-Shank1b overexpression enhanced spine maturation but did not alter the number of filopodia formed. (E) Dendritic protrusions induced by paralemmin-1 are synaptic. The number of synaptophysin-positive clusters were measured and normalized to controls expressing GFP. GFP-PALM-S and GFP-PALM-L but not GFP-PALM-S (C334,6,7S) significantly increased the number of synaptophysin (Syn) positive clusters when compared with GFP controls. Number of cells analyzed for each group is indicated at the bottom of each bar. Number of filopodia and spines analyzed per group in A are, respectively: GFP +RFP = 120 and 334, PALM (CT) +RFP = 628 and 878, PALM-S +RFP = 996 and 1124, PALM-L+RFP = 565 and 1386, PALM-S (C334, 6, 7S) = 86 and 76, PALM-S (C336S) = 180 and 144, PALM-S (C334S) = 187 and 118, PALM-L (C336S) = 115 and 112, and Shank1b+RFP = 103 and 1572, respectively. *p < 0.05, **p < 0.01, ***p < 0.001; n.s., no significant difference. Data represent mean ± SEM. Scale bars, 10 μm.
Figure 3.
Figure 3.
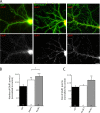
Differential effects of paralemmin-1 splice variants on GluR1 accumulation in dendritic spines. (A) Hippocampal neurons were transfected at DIV 7 with either GFP (green), GFP-tagged paralemmin-S (GFP-PALM-S), or GFP-tagged paralemmin-L (GFP-PALM-L) and fixed and stained with GluR1 specific antibodies (red) at DIV 14. (B) Number of GluR1 puncta was significantly increased in neurons expressing GFP-PALM-L and GFP-PALM-S when compared with GFP-expressing controls. (C) GluR1 puncta size was significantly increased in neurons expressing GFP-PALM-L but not GFP-PALM-S. Number of cells analyzed for each group is indicated at the bottom of each bar. *p < 0.05, **p < 0.01, ***p < 0.001. Data represent mean ± SEM. Scale bar, 10 μm.
Figure 4.
Figure 4.
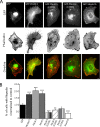
Induction of filopodia by paralemmin-1 but not Shank1b in COS-7 cells. (A) Various constructs fused to GFP (green) were transfected into COS-7 cells, fixed, and stained with rhodamine-conjugated phalloidin (red). Representative images of cells transfected with either GFP (green), GFP-tagged paralemmin CT (GFP-PALM(CT)), GFP-tagged paralemmin-S (GFP-PALM-S), palmitoylation mutant forms of paralemmin-1 lacking Cys 336 (GFP-PALM-S (C336S), GFP-PALM-L (C336S), or GFP-tagged Shank1b (GFP-Shank1b) are shown in top panels. (B) Quantification of filopodia induction was measured by counting the number of cells that showed filopodia outgrowth. Cells immunolabeled for phalloidin are shown in middle panels. Analysis demonstrates that wild-type forms of paralemmin-1 but not the palmitoylation deficient forms or Shank1b significantly increase the number of cells with filopodia when compared with GFP-expressing cells. Additionally, appending the C-terminal acylated motif of paralemmin-1 to GFP [GFP-PALM(CT)] is sufficient for filopodia induction in COS-7 cells. Number of cells analyzed for each group, ≥69. **p < 0.01, ***p < 0.001. Data represent mean ± SEM. Scale bar, 5 μm.
Figure 5.
Figure 5.
Shank1b but not paralemmin-1 induces rapid protrusion transformation from filopodia to spine-like structures. (A) Neurons were transfected with RFP- and GFP-tagged Shank1b (GFP-Shank1b) at DIV 7 and then fixed at either DIV 9 or 10. GFP-Shank1b expression decreases the ratio of filopodia to spines formed when compared with neurons expressing GFP. (B) Quantification of changes in dendritic protrusions per unit length. (C–E) Hippocampal neurons were transfected with RFP and either with GFP, GFP-tagged paralemmin-L (GFP-PALM-L) or YFP-tagged Shank1b (YFP-Shank1b) at DIV 7 and then imaged at DIV 9 using time-lapse microscopy. Images were acquired every 2 min. In C, these images represent a transition from a filopodium (t = 34 and 42 min) to a spine-like protrusion at (t = 38 and 130 min). In D, these images represent a spine induced by Shank1b that remained stable from t = 0 min to t = 120 min. In E, at t = 0 min, the image shows a filopodia-like protrusion containing a Shank1b cluster that retracts to form a spine-like protrusion at t = 32 min and remains stable. (F) Analysis revealed differential effects of GFP-PALM-L on protrusion dynamics. Most significant is enhanced membrane dynamics and protrusion turnover in cells expressing GFP-PALM-L as well as the number of stable spines in neurons expressing YFP-Shank1b but not GFP-PALM-L on a time scale of 2–3 h. Number of cells analyzed for each group is indicated at the bottom of each bar. Number of filopodia and spines analyzed per group in A are as follows: DIV 7 + 2: GFP+RFP = 127 and 62 and GFP-Shank1b+RFP = 178 and 375; DIV 7 + 3: GFP+RFP = 240 and 123 and GFP-Shank1b+RFP = 135 and 641. White arrowheads denote dendritic protrusions. *p < 0.05, **p < 0.01, ***p < 0.001; n.s. = no significant difference. Data represent mean ± SEM. Scale bar, (A) 10 μm; (C–E) 1 μm.
Figure 6.
Figure 6.
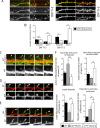
Effects of long-term knockdown of paralemmin-1 on spine formation. (A) Hippocampal neurons were cotransfected with GFP-actin and either with control RNAi (Ctl RNAi) or paralemmin-1–specific RNAi (PALM RNAi) at DIV 5. Neurons were then fixed and stained for endogenous paralemmin-1 (Endogenous PALM) at DIV 12–14. (B) Quantification of dendritic spines normalized to Ctl RNAi group. There is a significant reduction in dendritic spines in neurons transfected with PALM RNAi. (C) Hippocampal neurons cotransfected with GFP or GFP-Shank1b and either with empty pSUPER vector or with PALM RNAi. (D) Quantification of GFP-Shank1b–positive spines upon knockdown of paralemmin-1. A significant reduction in GFP-Shank1b clustering as well as the number of Shank1b-positive dendritic spines in neurons transfected with GFP-Shank1b and PALM RNAi compared with controls expressing GFP-Shank1b and empty pSUPER vector. Number of cells analyzed for each group is indicated at the bottom of each bar. Number of filopodia and spines analyzed per group in B are as follows: GFP-actin+Ctl RNAi = 316 and 281, GFP-actin+PALM RNAi = 230 and 176. Number of spines analyzed per group in D is as follows: GFP+pSUPER vector = 1039, GFP Shank1b+pSUPER vector = 1564, and GFP Shank1b+PALM RNAi = 446. ***p < 0.001. Data represent mean ± SEM. Scale bar, (A) 5 μm; (C) 10 and 5 μm (magnified dendrite).
Figure 7.
Figure 7.
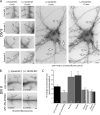
Neuronal activity modulates paralemmin-1 localization. (A) Hippocampal neurons were treated with 90 mM KCl or vehicle control for 3 min and fixed and stained for endogenous paralemmin-1 (Endogenous PALM). Endogenous PALM accumulation at the plasma membrane is enhanced after stimulation with 90 mM KCl when compared with untreated cells. 2-bromopalmitate (2-BP) treatment reduces Endogenous PALM accumulation at the plasma membrane at basal conditions and after KCl treatment. (B) Graph showing quantification of changes in Endogenous PALM accumulation at the membrane across four treatment groups. (C) Photoconductive stimulation increases GFP-paralemmin-L accumulation at the plasma membrane. Neurons were transfected with GFP-tagged paralemmin-L (GFP-PALM-L) and then imaged for several minutes before stimulation. White arrowheads indicate changes in accumulation of paralemmin-L before and after electrical stimulation. (D) Quantification showing a significant increase in GFP-PALM-L accumulation at the plasma membrane compared with unstimulated neurons. (E) Changes in paralemmin-1 levels in the membrane fraction after KCl treatment. Cortical neurons at DIV 16–20 were treated for 3 min with 90 mM KCl and changes in paralemmin-1 distribution was examined by subcellular fractionation. Quantification of paralemmin-1 levels in the membrane fraction was determined by calculating the amount of paralemmin-1 in the soluble/pellet fractions. Paralemmin-1 levels in the pellet (membrane) fractions of treated cells (58.1 ± 7.7%; *p < 0.02) were higher than those of untreated controls (45.0 ± 5.8%; *p < 0.02). There were no significant changes in the amounts of transferrin in the membrane fractions across groups; p = 0.75. Number of cells analyzed for each group is indicated at the bottom of each bar. **p < 0.01, ***p < 0.001; n.s. = no significant difference. Data represent mean ± SEM. Scale bar, (A) 10 μm; (C) 5 μm.
Figure 8.
Figure 8.
Activity-induced changes in dendritic protrusions are modulated by paralemmin-1. (A) Paralemmin-1 modulates neuronal activity-driven changes in protrusion size. Hippocampal neurons were transfected at DIV 7 with GFP+Ctl RNAi, GFP+PALM RNAi, GFP-tagged paralemmin-1 splice variants GFP-PALM-L, GFP-PALM-S, or the cysteine mutant forms GFP-PALM-S (C336S) or GFP-PALM-S (C334S, C336S, C337S) and then imaged at DIV 9. Images were captured before and after 10 min treatment with 50 mM KCl. Images of inverted fluorescence are shown to better visualize protrusions. Four examples of dendritic protrusion expansion are shown before and after stimulation with 50 mM KCl. Example 1, filopodia expanded at the tips; example 2, formation of a growth cone-like protrusion; example 3, enlargement of an existing protrusion; and example 4, formation of lamellopodia-like structures at the base of the protrusion. Images shown here represent inverted fluorescence for greater clarity. (B) Example of protrusion expansion in GFP+Ctl RNAi at DIV 9 after stimulation with 50 mM KCl for 10 min, and this effect is reduced in cells coexpressing GFP+PALM RNAi. Images shown here represent inverted fluorescence for greater clarity. (C) Treatment with KCl results in a small but significant increase in protrusion size in GFP+Ctl RNAi-transfected controls. Coexpression of GFP+ PALM RNAi significantly reduces the effect on protrusion expansion. Expression of GFP-PALM-S and GFP-PALM-L but not the acylation mutant forms of PALM-S significantly enhanced dendritic protrusion expansion. Protrusion diameter was measured at the base and tips, before and after stimulation and expressed as a percent change. Arrowheads point to expanded protrusions. Number of cells analyzed for each group is indicated at the bottom of each bar. *p < 0.05, **p < 0.01. Data represent mean ± SEM. Scale bar, (A, right panels) 5 μm; (A, left insets), 2 μm; and (B) 2 μm.

References

    1. Anderson R. G., Jacobson K. A role for lipid shells in targeting proteins to caveolae, rafts, and other lipid domains. Science. 2002;296:1821–1825. - PubMed
    1. Basile M., Lin R., Kabbani N., Karpa K., Kilimann M., Simpson I., Kester M. Paralemmin interacts with D3 dopamine receptors: implications for membrane localization and cAMP signaling. Arch. Biochem. Biophys. 2006;446:60–68. - PubMed
    1. Berzat A. C., Buss J. E., Chenette E. J., Weinbaum C. A., Shutes A., Der C. J., Minden A., Cox A. D. Transforming activity of the Rho family GTPase, Wrch-1, a Wnt-regulated Cdc42 homolog, is dependent on a novel carboxyl-terminal palmitoylation motif. J. Biol. Chem. 2005;280:33055–33065. - PubMed
    1. Bredt D. S., Nicoll R. A. AMPA receptor trafficking at excitatory synapses. Neuron. 2003;40:361–379. - PubMed
    1. Burwinkel B., Miglierini G., Jenne D. E., Gilbert D. J., Copeland N. G., Jenkins N. A., Ring H. Z., Francke U., Kilimann M. W. Structure of the human paralemmin gene (PALM), mapping to human chromosome 19p13.3 and mouse chromosome 10, and exclusion of coding mutations in grizzled, mocha, jittery, and hesitant mice. Genomics. 1998;49:462–466. - PubMed

Publication types