. 2008 May;19(5):1893-902.
doi: 10.1091/mbc.e07-07-0683. Epub 2008 Feb 20.

GRIM-19 is essential for maintenance of mitochondrial membrane potential

Affiliations

GRIM-19 is essential for maintenance of mitochondrial membrane potential

Hao Lu et al. Mol Biol Cell. 2008 May.

Abstract

GRIM-19 was found to copurify with complex I of mitochondrial respiratory chain and subsequently was demonstrated to be involved in complex I assembly and activity. To further understand its function in complex I, we dissected its functional domains by generating a number of deletion, truncation, and point mutants. The mitochondrial localization sequences were located at the N-terminus. Strikingly, deletion of residues 70-80, 90-100, or the whole C-terminal region (70-144) led to a loss of mitochondrial transmembrane potential (DeltaPsim). However, similar deletions of another two complex I subunits, NDUFA9 and NDUFS3, did not show such effect. We also found that deletion of the last 10 residues affected GRIM-19's ability to be assembled to complex I. We constructed a dominant-negative mutant containing the N-terminal 60 and the last C-terminal 10 residues, which could be assembled into complex I, but failed to maintain normal DeltaPsim. Cells overexpressing this mutant did not spontaneously undergo cell death, but were sensitized to apoptosis induced by cell death agents. Our results demonstrate that GRIM-19 is required for electron transfer activity of complex I, and disruption of DeltaPsim by GRIM-19 mutants enhances the cells' sensitivity to apoptotic stimuli.


Figures

Figure 1.
Figure 1.
GRIM-19 aa 20–30 and 40–60 are mitochondrial localization signals. (A) Schematic diagram of GRIM-19 internal deletion and C-terminal deletion mutants. For internal deletion mutants, ∼10 aa was deleted in each mutant from the N- to the C-terminus. Larger deletion mutants Δ96–124 and Δ96–134 were also included. Numbers indicate aa in GRIM-19. (B) WT and the internal deletion mutants of GRIM-19 were transfected into MCF-7 cells. Subcellular localization of GRIM-19 proteins was detected by anti-HA primary antibody and FITC-conjugated secondary antibody (green). Mitochondria were labeled with Mito-Tracker Red CMXRos (red). Cells were mounted and examined with a confocal microscopy (Radiance 2000, Bio-Rad). Merged images are shown. Scale bar, 10 μm. (C) A series of GRIM-19 internal deletion mutants were transfected into HEK 293T cells. Subcellular localization of different GRIM19 deletion mutants were determined by cellular fractionation. The mitochondrial and cytosolic fractions were collected and subjected to Western blot analysis probed with antibodies as indicated. The expression levels of the WT and mutant GRIM-19 in total cell lysate are also shown.
Figure 2.
Figure 2.
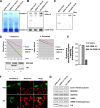
Aa 134–144 of GRIM-19 affects its assembly ability to complex I. (A and B) HA-tagged GRIM-19 mutants were transfected into 293T cells. BN-PAGE was used to separate mitochondrial RC complexes and subjected to Western blot analysis. Anti-HA antibody was used to detect transfected WT or mutant GRIM-19 presented in complex I (top panels). GRIM-19 antibody was used to detect both transfected and endogenous GRIM-19 (second panels). Mitochondrial complex II was detected by antibody against the 70-kDa subunit of complex II, as a control (third panels). Expression levels of transfected GRIM-19 were monitored by SDS-PAGE and Western blot analysis using anti-HA antibody (bottom panels). (C) Sequence comparison of the last 10 aa of GRIM-19 among different species. Highly conserved Gly (G) and Tyr (Y) are highlighted. (D) GRIM-19 point mutants (Y139A, Y139D, G143R, and G143V) were transfected into 293T cells. The experiments were performed as described in A and B. WT and mutant 1–96 were included as controls.
Figure 3.
Figure 3.
Aa 70–80 and 90–100 of GRIM-19 are required for maintenance of ΔΨm. (A) HA-tagged GRIM-19 internal deletion mutants (Δ70–80, Δ80–90, and Δ90–100) and truncation mutants (1–90, 1–80, and 1–70) were transfected into MCF-7 cells. GRIM-19 proteins were detected with anti-HA antibody and FITC-conjugated secondary antibody (green). Mitochondria were labeled with Mito-Tracker Red CMXRos (red). ΔΨm was detected by the staining of Mito-Tracker CMXRos. Cells were mounted and examined with a confocal microscope (left and middle panels). One hundred transfected cells from each group were randomly selected, and the number of the cells that lost ΔΨm was counted and indicated as percentage of the total cells. The numbers represent the mean of three independent experiments, with SD shown as error bars (right panel). (B) Vector, WT-GRIM-19, GRIM-19 internal deletion mutants (Δ70–80, Δ90–100) and DN-GRIM-19 were transfected into MCF-7 cells. After transfection for 24 h, cells were stained with 50 nM TMRE and subjected to FACS analysis. Events (n = 30,000) were counted for each group. As controls, untransfected cells were either treated with 10 μM of FCCP for 2 h (for complete depolarization) or 4 μM of rotenone for 4 h (for inhibition of complex I) before harvesting for FACS. The reading of TMRE staining intensity in FCCP-treated cells was set to 0 in FACS measurement. Percentage of total cells with low ΔΨm is indicated. (C and D) Two complex I subunits, NDUFA9 (C) and NDUFS3 (D) and the mutants are illustrated on top of the figures. Close boxes at the N-termini indicate the mitochondrial localization signal sequences predicted using MITOPROT server. The numbers represent aa contained in the WT and mutant constructs. The indirect immunofluorescence experiment was performed as described in A. Scale bar,10 μm.
Figure 4.
Figure 4.
DN-GRIM-19 strongly reduces ΔΨm. (A) Schematic diagram of DN-GRIM-19. The numbers indicate aa. (B) WT and DN-GRIM-19 were transfected into MCF-7 cells. GRIM-19 proteins were detected by anti-HA primary antibody and FITC-conjugated secondary antibody (green). ΔΨm was detected with Mito-Tracker CMXRos (red). Nuclei were stained with TOPRO-3 (blue). The merged images are shown. (C) Vector, WT-GRIM-19, deletion mutant 1–60, and DN-GRIM-19 were transfected into MCF-7 cells. Immunostaining was performed as described above. Transfected cells (n = 100) were randomly picked. The number of cells showing low ΔΨm was counted, and the percentage of such cells was calculated and presented in bar graphs as the mean of three experiments with SD shown as error bars in the right panel. (D) Experiments were performed as described in B, except that instead of TORPO-3 staining, cells were stained with anti-COX IV antibody and CY5-conjugated secondary antibody (blue).
Figure 5.
Figure 5.
DN-GRIM-19 decreases mitochondrial complex I electron transfer activity. (A) WT, DN, and deletion mutant 1–60 of GRIM-19 were transfected into HEK 293T cells. After transfection for 24 h, cells were harvested, and mitochondria from cells were isolated. Mitochondrial proteins were solubilized and separated by BN-PAGE. Enzymatic activity of complex I and II were measured in gel respectively as described in Materials and Methods. (B and C) Transfection and BN-PAGE were performed as described in A, followed by Western blot analysis. (B) Anti-GRIM-19 antibody was used to detect the total GRIM-19 proteins in mitochondrial complex I, and anti-complex II 70-kDa subunit antibody was used to detect the complex II. (C) Anti-HA antibody was used to detect the amount of transfected proteins (WT, DN and 1–60 of GRIM-19) which were assembled in mitochondrial complex I. (D) HEK 293T cells were transfected with vector, WT, or DN-GRIM-19. Mitochondrial fraction was isolated, and NADH oxidation was measured in the absence or presence of rotenone by a change of OD reading at 340-nm wavelength per 10 s as described in Materials and Methods. The rate of NADH oxidation of each cell population is listed in Table 1. The same amount of mitochondria from cells transfected with vector (lane 1), WT- (lane 2), or DN-GRIM-19 (lane 3) was lysed and subjected to Western blot analysis shown in the bottom panels. NDUFA9 antibody was used to monitor the amount of complex I, and the expression levels of transfected plasmids are shown by probing with anti-HA antibody. (E) The rotenone sensitive complex I activity was quantified from data shown in Table 1 and is indicated with a bar graph. (F) DN-GRIM-19 was transfected into human 143B cells or ρ0 cells. DN-GRIM-19 proteins were detected by anti-HA polyclonal primary antibody and FITC-conjugated secondary antibody (green). ΔΨm was detected with Mito-Tracker CMXRos (red). Scale bar, 10 μm. (G) The same samples for BN-PAGE described in A were denatured by boiling in the equal volume of 2× protein loading buffer, separated with SDS-PAGE, and subjected to Western blotting with anti-complex II 70-kDa subunit, anti-NDUFA9, anti-NDUFS3, anti-VADC, anti-GRIM-19, and anti-HA antibodies. Anti-GRIM-19 antibody was used to detect the endogenous GRIM-19, whereas anti-HA antibody was used to detect the transfected WT-, DN-, and GRIM-19 1–60.
Figure 6.
Figure 6.
Loss of ΔΨm caused by DN-GRIM-19 does not induce cytochrome c release. WT and DN-GRIM-19 were transfected into MCF-7 cells that stably express caspase-3. The transfected GRIM-19 were detected by anti-HA primary antibody and FITC-conjugated secondary antibody (green). ΔΨm was detected by Mito-Tracker Red CMXRos staining (red). Cytochrome c was detected with anti-cytochrome c antibody (blue). The merged images are shown.
Figure 7.
Figure 7.
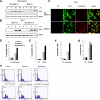
DN-GRIM-19 sensitizes cells to cytochrome c release and apoptosis. (A) WT- and DN-GRIM-19 were transfected into HeLa cells. Twenty-four hours after transfection, cells were incubated with 1 μM staurosporine for various times. Cytochrome c release assay was conducted as described in Material and Methods. (B) WT and DN-GRIM-19 were transfected into MCF-7 cell line stably expressing caspase 3. Twenty-four hours after transfection, cells were either untreated (un) or treated with 4 ng/ml TNF-α for the period as indicated. Cytochrome c release assay was performed as described in A. (C) WT and DN-GRIM-19 were transfected into MCF-7 cells as described in B, and cells were treated with TNF-α for 3 h. Immunofluorescence experiments were conducted. GRIM-19 proteins were detected with polyclonal anti-HA antibody and Cy5-conjugated secondary antibody (blue). Cytochrome c was detected with anti-cytochrome c mAb and FITC-conjugated secondary antibody (green). Scale bar, 10 μm. (D) MCF-7 cells stably expressing caspase 3 were transfected with vector, WT, or DN-GRIM-19. Twenty-four hours after transfection, cells were treated with 4 ng/ml TNF-α for 8 h. Immunofluorescence experiments were conducted as described in C. One hundred transfected cells were randomly picked. The number of cells showing cytochrome c release was counted, and the percentage of such cells was calculated and presented in bar graphs as the mean of three experiments with SD shown as error bars. (E–G) HeLa cells were transfected with vector, WT, or DN-GRIM-19 and treated with rotenone (5 μM) for 10 h, ionomycin (200 μM) for 24 h, or IFN-β (1000 u/ml) and RA (2 μM) for 48 h. The experiments were performed as described in D. (H) HEK 293T cells were transfected with vector, WT, or DN-GRIM-19. Cells were either untreated or treated with etoposide for 24 h. DNA content was analyzed by flow cytometry after staining with PI. The percentage of sub-G1 cells is indicated. The data show a representative of three independent experiments.
Figure 8.
Figure 8.
Functional domains of GRIM-19. The mitochondrial targeting sequences and functional domains are summarized in a schematic diagram. The numbers indicate aa of GRIM-19. The red, yellow, and green boxes represent sequences for mitochondrial targeting, maintenance of ΔΨm, and enhancing assembly, respectively. TM, predicted transmembrane domain.

References

    1. Angell J. E., Lindner D. J., Shapiro P. S., Hofmann E. R., Kalvakolanu D. V. Identification of GRIM-19, a novel cell death-regulatory gene induced by the interferon-beta and retinoic acid combination, using a genetic approach. J. Biol. Chem. 2000;275:33416–33426. - PubMed
    1. Appleby R. D., Porteous W. K., Hughes G., James A. M., Shannon D., Wei Y. H., Murphy M. P. Quantitation and origin of the mitochondrial membrane potential in human cells lacking mitochondrial DNA. Eur. J. Biochem. 1999;262:108–116. - PubMed
    1. Carroll J., Fearnley I. M., Shannon R. J., Hirst J., Walker J. E. Analysis of the subunit composition of complex I from bovine heart mitochondria. Mol. Cell Proteomics. 2003;2:117–126. - PubMed
    1. Carroll J., Fearnley I. M., Skehel J. M., Runswick M. J., Shannon R. J., Hirst J., Walker J. E. The post-translational modifications of the nuclear encoded subunits of complex I from bovine heart mitochondria. Mol. Cell. Proteomics. 2005;4:693–699. - PubMed
    1. Carroll J., Fearnley I. M., Skehel J. M., Shannon R. J., Hirst J., Walker J. E. Bovine complex I is a complex of 45 different subunits. J. Biol. Chem. 2006;281:32724–32727. - PubMed

Publication types

MeSH terms