. 2008 May;19(5):1952-61.
doi: 10.1091/mbc.e06-12-1156. Epub 2008 Feb 20.

Ste20-related protein kinase LOSK (SLK) controls microtubule radial array in interphase

Affiliations

Ste20-related protein kinase LOSK (SLK) controls microtubule radial array in interphase

Anton V Burakov et al. Mol Biol Cell. 2008 May.

Abstract

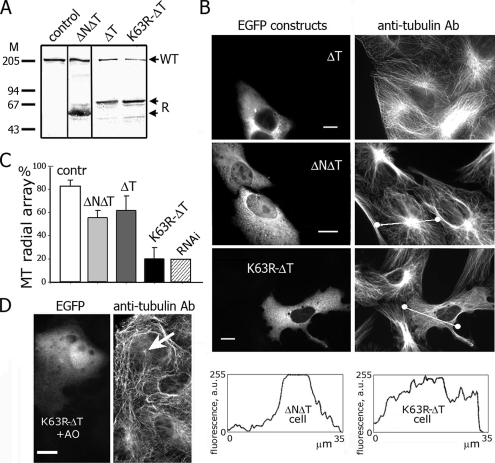
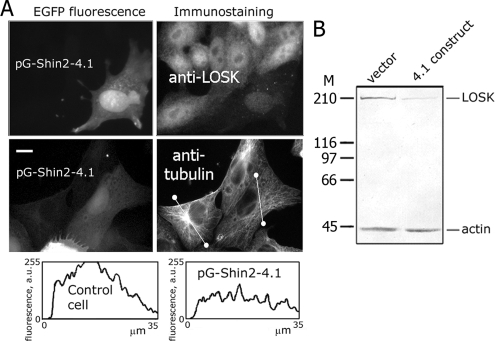
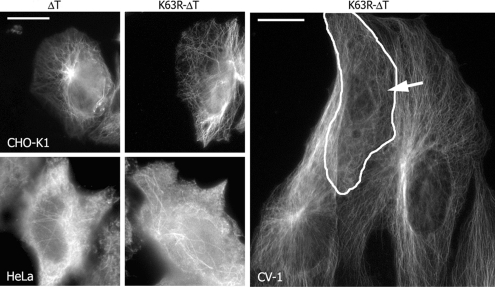
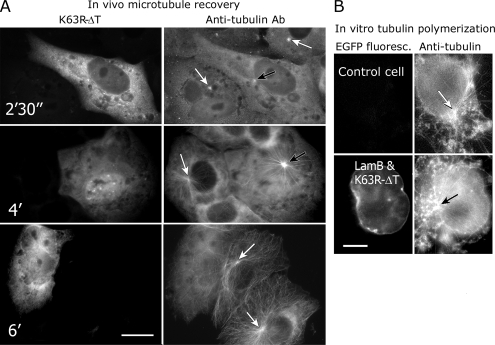
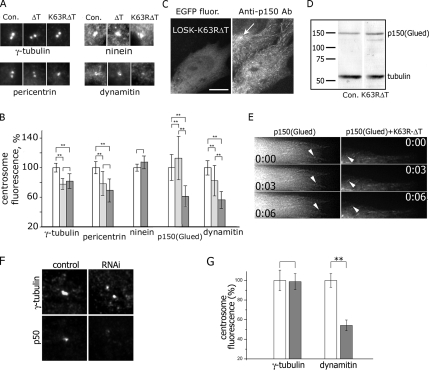
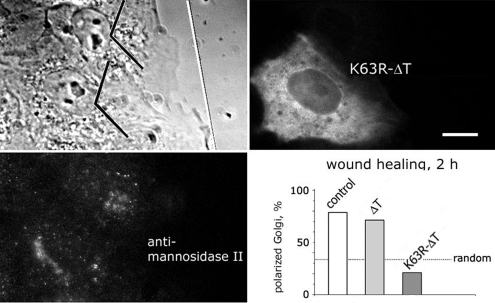
Interphase microtubules are organized into a radial array with centrosome in the center. This organization is a subject of cellular regulation that can be driven by protein phosphorylation. Only few protein kinases that regulate microtubule array in interphase cells have been described. Ste20-like protein kinase LOSK (SLK) was identified as a microtubule and centrosome-associated protein. In this study we have shown that the inhibition of LOSK activity by dominant-negative mutant K63R-DeltaT or by LOSK depletion with RNAi leads to unfocused microtubule arrangement. Microtubule disorganization is prominent in Vero, CV-1, and CHO-K1 cells but less distinct in HeLa cells. The effect is a result neither of microtubule stabilization nor of centrosome disruption. In cells with suppressed LOSK activity centrosomes are unable to anchor or to cap microtubules, though they keep nucleating microtubules. These centrosomes are depleted of dynactin. Vero cells overexpressing K63R-DeltaT have normal dynactin "comets" at microtubule ends and unaltered morphology of Golgi complex but are unable to polarize it at the wound edge. We conclude that protein kinase LOSK is required for radial microtubule organization and for the proper localization of Golgi complex in various cell types.


Figures

Figure 1.
Figure 1.
Protein kinase LOSK ΔT fragment possesses catalytic activity in vitro that can be inhibited with an excess of K63R-ΔT but not with other LOSK fragments. (A) The structure of the LOSK molecule and its fragments used in this work. Numbers indicate amino acids. CD, catalytic domain; AD, acid central domain with indefinite secondary structure; CC, predicted coiled-coil domain. (B) The inhibitory effect of K63R-ΔT to ΔT activity in vitro. Lanes 1–6, Coomassie-stained gel; lanes 1′–6′, radioautograph of the same gel. Each reaction mixture included 0.5 μg of MBP and 0.3 μg of ΔT, except lanes 2 and 2′ with K63R-ΔT alone. Lanes 3–6 and 3′–6′, the amount of K63R-ΔT (μg) added is indicated. (C). The influence of LOSK fragments on ΔT activity in vitro. ΔNΔT partially inhibited ΔT activity; M1f, M2f, and Ct had no effect. Note the highly deviant electrophoretic mobility of M1f (predicted molecular mass of fused with GST M1f is 63 kDa). Molecular mass markers are indicated (kDa).
Figure 2.
Figure 2.
Protein kinase LOSK interacts with cellular microtubules. (A) EGFP-fused full-length LOSK expressed in HeLa cells is partially distributed along microtubules. Top panels, overview of the cell; bottom panels, higher magnification of boxed areas. The white arrow points to distinctive structures; the black arrow points to LOSK-lacking microtubules. (B and C) Acetylated tubulin, which specifies stabilized microtubules, is not accumulated in cells expressing either K63R-ΔT or ΔT and is slightly increased in Ct-expressing cells. At high expression level, the Ct fragment is partially distributed along microtubules. Scale bars, 10 μm (2 μm in bottom panels in A).
Figure 3.
Figure 3.
The expression of dominant-negative K63R-ΔT in Vero cells alters radial microtubule arrays. (A) Immunoblotting of cell homogenates with anti-LOSK Ab polKIA. Lane 1, nontransfected cells, lanes 2–4, cells transfected with ΔT (2), K63R-ΔT (3), and ΔNΔT (4). Molecular mass markers are indicated (kDa). WT, cellular wild-type LOSK; R, recombinant LOSK fragments. (B) Vero cells expressing active ΔT and inactive ΔNΔT showed unaltered microtubule arrays, and cells expressing K63R-ΔT had disorganized microtubules. Bottom, scans of fluorescence intensity along lines shown in the cell images. (C) The frequency of cells containing distinct radial microtubule arrays. Fifty cells were counted in three independent experiments. Error bars, SD. (D) Microtubule aster (arrow) is visible in cell expressing K63R-ΔT after treatment with okadaic acid. Scale bars, 10 μm.
Figure 4.
Figure 4.
Depletion of LOSK in cells by RNAi alters radial microtubule arrays. (A) Immunostaining of LOSK (top right) and microtubules (middle right) in cells at day 8 after transfection with pG-Shin2-4.1. Bottom right, scans of fluorescence intensity along lines shown in the cell images. Scale bar, 10 μm. (B) Immunoblotting of LOSK and actin in cells transfected with either empty vector or pG-Shin2-4.1 and selected with FACS at day 8 after transfection. Molecular mass markers are indicated (kDa).
Figure 5.
Figure 5.
K63R-ΔT expression disrupts the organization of radial microtubule arrays in CHO-K1 and CV-1 cells but does not influence microtubules in HeLa cells. A transfected CV-1 cell is encircled and marked with an arrow. CHO-K1 and HeLa cells were chilled in ice and then warmed during 15 min; CV-1 cells were simply grown at 37°C. Scale bar, 10 μm.
Figure 6.
Figure 6.
K63R-ΔT expression in Vero cells inhibits anchoring/capping of microtubules at the centrosome but does not inhibit microtubule nucleation. (A) Vero cells were treated with nocodazole for 2 h and then washed for the time indicated in the pictures. White arrows point to microtubule asters in control cells and black arrows to microtubule asters in cells expressing K63R-ΔT. (B) Vero cells expressing EGFP-lamin B and K63R-ΔT were treated with nocodazole, permeabilized with Triton X-100, and incubated with purified tubulin at 37°C. Microtubules organize as asters around centrosomes both in expressing and control cells. Scale bar, 10 μm.
Figure 7.
Figure 7.
The influence of LOSK on the content of major centrosomal proteins: the decrease of dynactin levels under either LOSK inhibition or depletion. (A) Pictures of typical centrosomes (matching average values shown in part B of this figure) immunostained with Abs to proteins indicated below the pictures. Con, control cells. (B) Immunostaining of K63R-ΔT–expressing cells with Ab to p150(Glued). The arrow points to the centrosome in a control (nontransfected) cell. Notice p150(Glued) “comets” at microtubule ends. Scale bar, 10 μm. (C) Bar graphs of fluorescence intensity of immunostained centrosomes. Thirty to 50 centrosomes were measured for each point; differences at *p < 0.05 and **p < 0.01. White bars, control cells; light gray, ΔT; dark gray, K63R-ΔT. (D) Immunoblotting of control (Con.) and K63R-ΔT–expressing cells treated with Ab to p150(Glued) and tubulin. Molecular mass markers are indicated (kDa). (E) Live imaging of a cell expressing either EGFP-p150(Glued) alone or a mixture of DsRed-Monomer-K63R-ΔT and EGFP-p150(Glued). Arrowheads point to “comets”; numbers indicate seconds. See also Video 1. (F) Double immunostaining of dynamitin (p50) and γ-tubulin in control and LOSK-depleted (RNAi) cells. (G) Bar graphs of fluorescence intensity of immunostained centrosomes. Centrosomes (n = 28–43) were measured for each point. White bars, control cells; gray bars, RNAi. For γ-tubulin data, p = 0.93, for p50 data p = 0.00017. Scale bar, 10 μm.
Figure 8.
Figure 8.
K63R-ΔT expression inhibits the polarization of the Golgi complex at a wound edge. Vero cells at wound edge 2 h after scratching of the monolayer. In the phase contrast image the direction of the scratch is shown as white line. Angle shape marks indicate leading cell thirds. In the bar graph one of three independent experiments is shown, n = 75, 42, and 38, respectively. Scale bar, 10 μm.

References

    1. Abe Y., Ohsugi M., Haraguchi K., Fujimoto J., Yamamoto T. LATS2-Ajuba complex regulates gamma-tubulin recruitment to centrosomes and spindle organization during mitosis. FEBS Lett. 2006;580:782–788. - PubMed
    1. Askham J. M., Vaughan K. T., Goodson H. V., Morrison E. E. Evidence that an interaction between EB1 and p150(Glued) is required for the formation and maintenance of a radial microtubule array anchored at the centrosome. Mol. Biol. Cell. 2002;13:3627–3645. - PMC - PubMed
    1. Barros T. P., Kinoshita K., Hyman A. A., Raff J. W. Aurora A activates D-TACC-Msps complexes exclusively at centrosomes to stabilize centrosomal microtubules. J. Cell Biol. 2005;170:1039–1046. - PMC - PubMed
    1. Bre M. H., Kreis T. E., Karsenti E. Control of microtubule nucleation and stability in Madin-Darby canine kidney cells: the occurrence of noncentrosomal, stable detyrosinated microtubules. J. Cell Biol. 1987;105:1283–1296. - PMC - PubMed
    1. Bulinski J. C., Borisy G. G. Immunofluorescence localization of HeLa cell microtubule-associated proteins on microtubules in vitro and in vivo. J. Cell Biol. 1980;87:792–801. - PMC - PubMed

Publication types

MeSH terms

LinkOut - more resources